The Monetary Transition
Posted On Wednesday, Nov 24, 2021
Inflation has been one of the biggest talking points globally in 2021. Rapidly rising commodity prices and acute supply chain disruption caused by the pandemic pushed up inflation to levels not seen for a very long time.
In the US, consumer price inflation jumped to 6.2% in October 2021, the highest print in over 30 years. In the Euro zone, CPI inflation surged to 13 years high at 4.1% in October 2021. Other Advanced and Emerging economies too witnessed an abnormal surge in inflation in the past few months.
Chart – I: Broad-based rise in Inflation
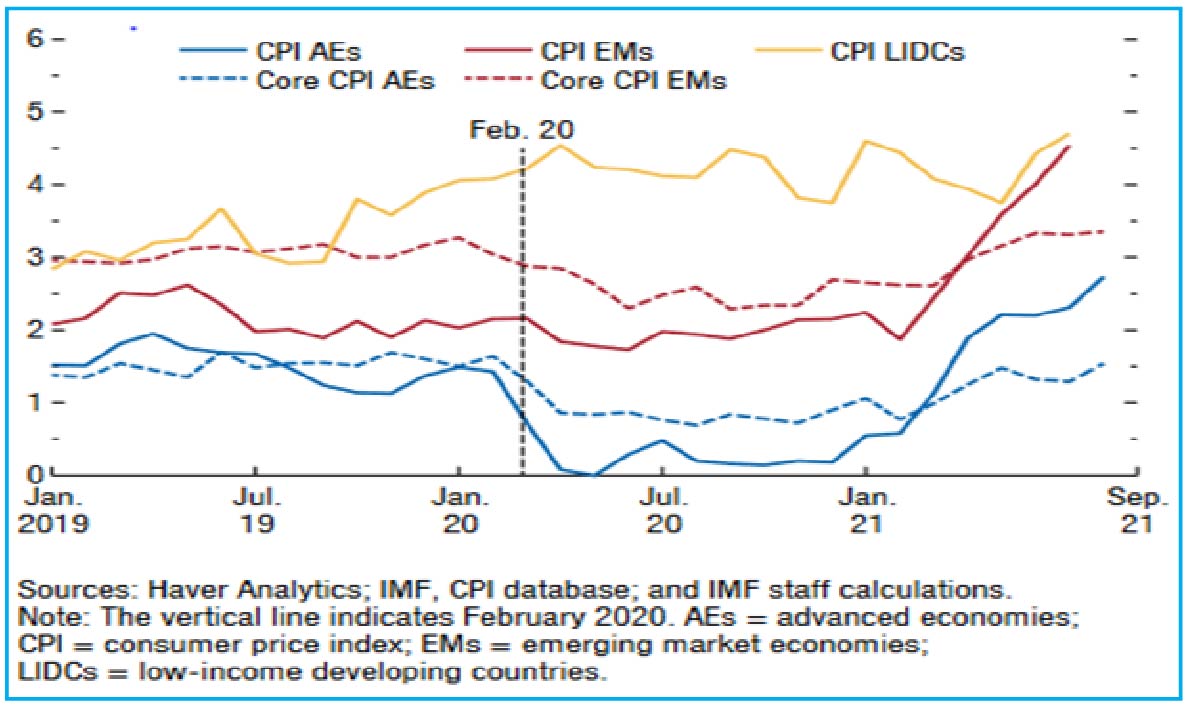
The chart is prepared by IMF and was published in the IMF World Economic Outlook in Oct 2021
As per the IMF, “headline inflation is projected to peak in the final months of 2021, with inflation expected back to pre-pandemic levels by mid-2022 for both advanced economies and emerging markets country groups, and with risks tilted to the upside.”
This is a near-consensus view that inflation will cool off from current levels in the coming 2-3 quarters as economies open up and the supply chain gets back on track. However, some expect it to remain above the so called ‘Neutral Rate of Inflation’ (rate of inflation at which demand and supply in an economy are in balance) for a longer period and require an immediate intervention by the policy makers to control its spiral.
Policy Shift
On the policy front, a distinct shift towards unwinding of pandemic stimulus is already taking hold. Many of the central banks have embarked on the path of reducing the crisis times liquidity and even hiking the interest rates.
Chart – II: Policy Shift in Central Banks
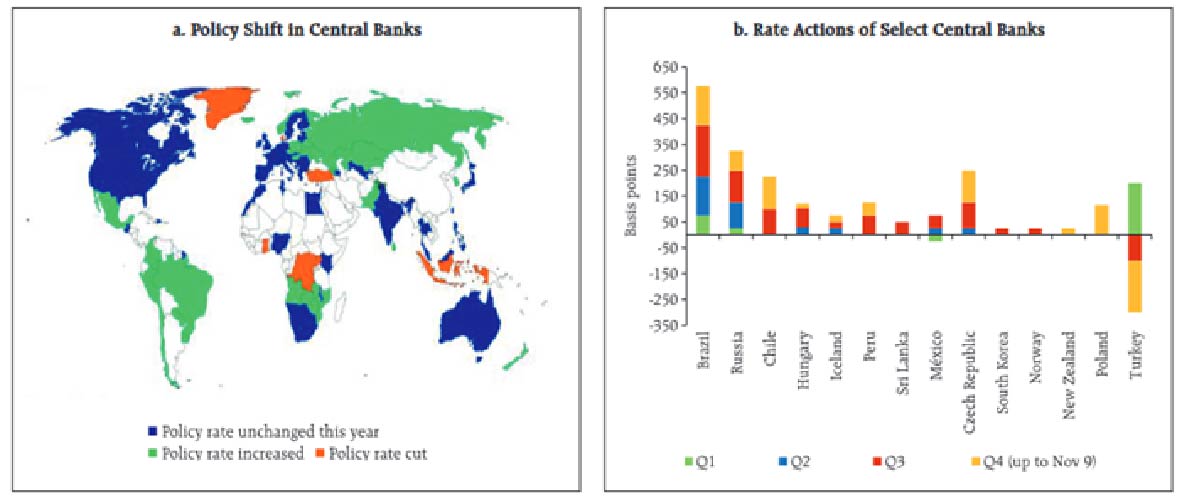
Source – RBI Bulletin, Data as of November 9, 2021
The US Fed, in its November meeting, announced the tapering of its asset purchases at the pace of USD 15 billion per month. Currently, the Fed is buying USD 80 billion of Treasury securities and USD 40 billion of agency mortgage-backed securities (MBS) on a monthly basis. At the announced pace of tapering, the FED will stop its bond-buying completely by mid-2022.
This was well communicated by the FED in advance and was awaited by the markets for some time. What caused the chaos in the market is that it started to move away from the Fed’s ‘transitory’ narrative on inflation.
The risk is that prolonged supply disruptions and elevated commodity prices coupled with demand pickup and unprecedented fiscal spending could de-anchor inflation expectations and force the Fed to tighten the monetary policy at a much faster pace than currently priced. This leaves the near-term outlook for central bank policy highly uncertain.
The bond market sell-off in the last two months is a manifestation of this conflict between the market and the central bankers and the increased policy uncertainty.
Chart - III: Bond Selloff on Inflation/Policy Uncertainty
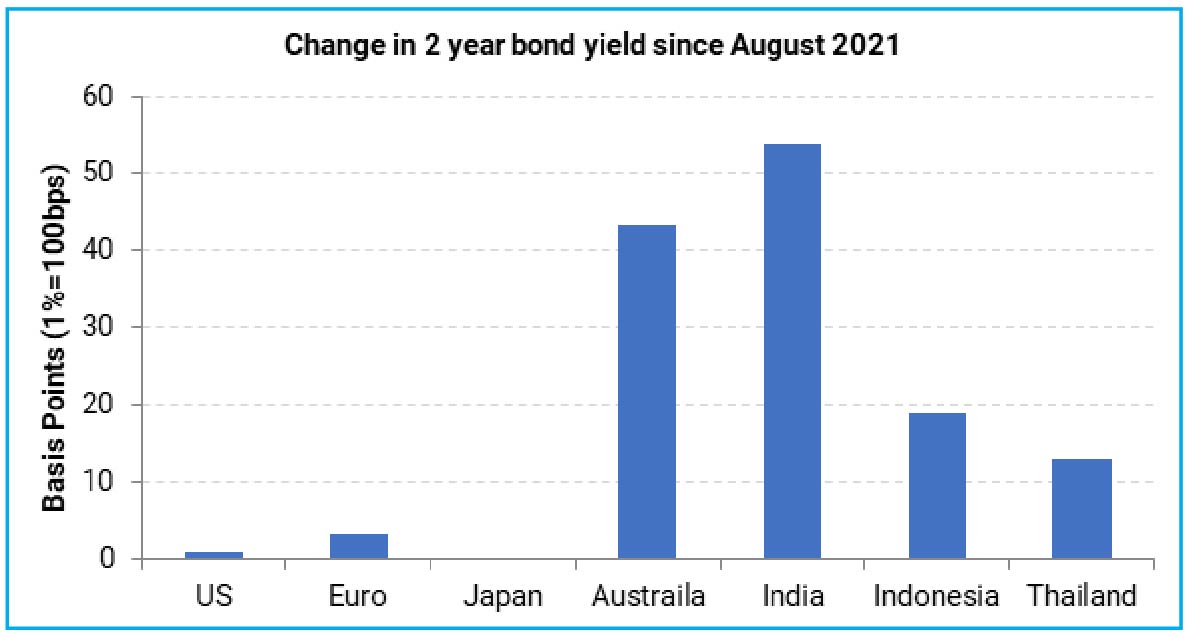
Source – Refinitiv, Quantum Research; Data as of November 17, 2021
Domestic Policy Path
India has its own story on inflation. Consumer price inflation in India inched up marginally to 4.48% in October 2021. This was the second consecutive month when retail inflation was in a 4% handle, closer to the RBI’s inflation target or the perceived ‘Neutral Rate of Inflation’ in the Indian context.
This brought in a sense of ease among the Indian policymakers, especially at the time when most of the major central banks are boxed by the abnormally high inflation trend.
Although headline CPI numbers are in a comfortable zone, the worrying part is that much of it is due to a favourable base effect from the last year’s high vegetable prices. As the base effect fade away by early 2022, inflation will likely move up again to the 6% mark.
The underlying inflation trend as measured by the Core-CPI (excludes the volatile food and fuel prices) is also running close to the RBI’s upper threshold of 6%. Inflationary pressures are reasonably broad-based as over half of the CPI basket is witnessing an inflation rate above 6% in the last three months. While over 20% of items are growing at more than 8%.
Chart – IV: India Retail Inflation near the RBI’s Upper Threshold
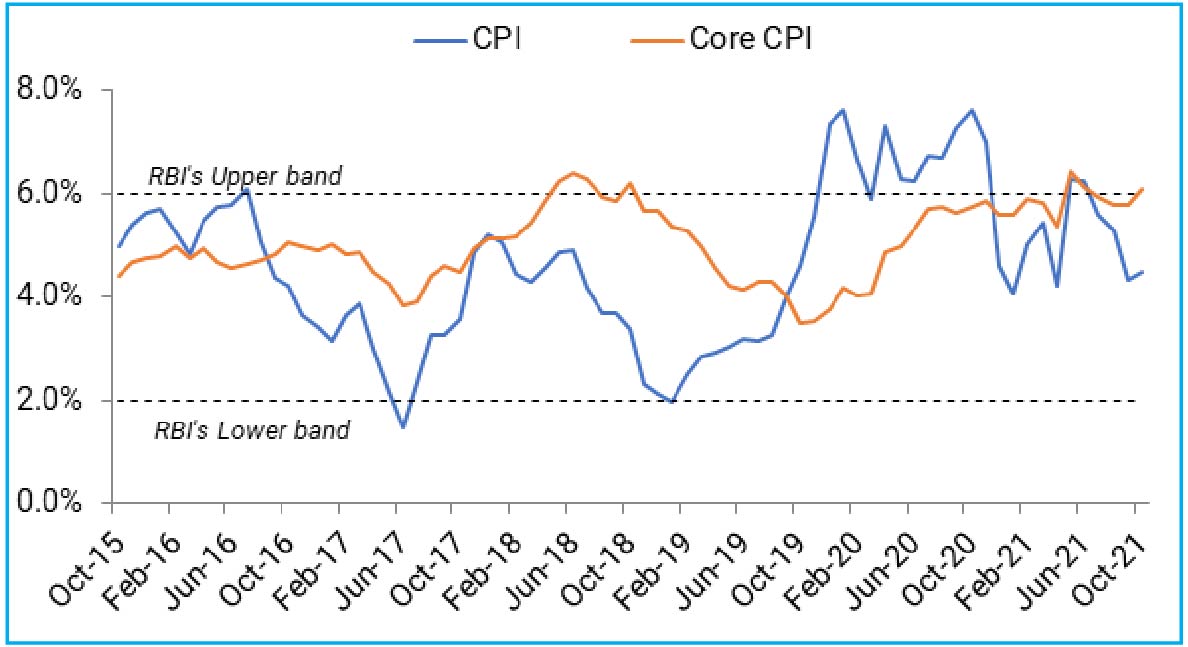
Source – MOSPI, Quantum Research; Data as of October 2021
The RBI Governor Shaktikanta Das, in a recent interview, has shown concern over elevated core inflation and highlighted it as “a policy challenge”.
With no increase in policy rates or in removing the durable liquidity, the RBI is behind many of its emerging market peers on the monetary policy cycle.
Over the last three months, it did act on the liquidity management and loosened its control over the sovereign yield curve.
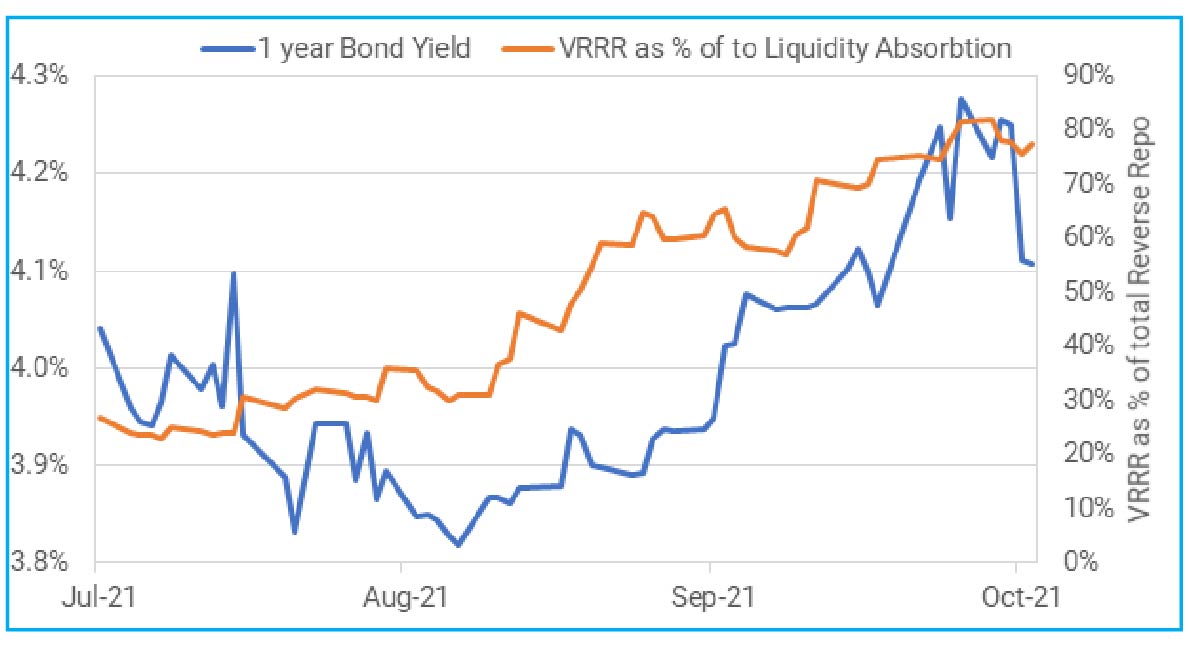
The RBI stopped its bond-buying program – GSAP and normalized the liquidity operations by increasing the quantum of variable rate reverse repo auctions (VRRR). This pushed the bond yields higher across the maturity curve with maximum 1-3 years maturity segment which moved up by about 30 basis points in the last two months.
Chart – V: Increased liquidity absorption through VRRRs pushed short term rates higher
Source – RBI, Refinitiv, Quantum Research; Data as of October 2021.
Past Performance may or may not sustained in future.
The next logical step in direction of policy normalization is a hike in the reverse repo rate. This should be followed by a change in policy stance from ‘accommodative’ to ‘neutral’ and subsequent repo rate hikes.
The direction of the monetary policy is more or less built in the market expectation and the current yield curve. Incremental change in the market expectations will be driven by the timing of stance change, the pace of rate hikes and the length of the rate hiking cycle or the terminal repo rate.
In the August 2021 edition of the Debt Market Observer – Investing in The New Normal, we argued that the rate hiking cycle would be much shallower this time with the RBI trying to keep the terminal repo rate closer to 5.0%-5.5%.
This assessment was based on the fact that much of domestic inflation is coming from supply chain disruptions and one-off price adjustments which should fade away over the period.
The pace of rate hikes will also be influenced by –
• Pace of growth recovery
• Household inflation expectations
• Global monetary policy
• Commodity prices with particular focus on crude oil
Taper without Tantrum
The US Federal Reserve has started to phase out its bond-buying program – a process commonly referred to as ‘Taper’. This was very well communicated and markets were better prepared this time. However, as the liquidity stops simultaneously across many major economies, we may see some bouts of volatility in the bond and currency markets.
India was one of the worst hit economies during the “taper tantrum” episode of 2013. India’s macroeconomic position and external accounts are in much better shape now than what it was in 2013. The RBI has also built a significantly large war chest of foreign exchange reserves, which now stands above USD 640 billion.
Though we may not see a meltdown like 2013, Indian markets might not be immune to any large shock in the global sphere given that India has attracted record amount of foreign capital flows in the last one and half years and the Indian Rupee is relatively overvalued compared to its emerging market peers.
Table - I: India not ‘Fragile’ anymore?
| India Macro Conditions | Pre and during Taper Tantrum of 2013 | Current Inflation Tantrum 2021 |
| GDP Growth | Post GFC stimulus pump primed growth but fizzed off | Below potential going into COVID. Recovering better than expected |
| Inflation | High Producer and Consumer Inflation | Near RBI’s upper threshold |
| Oil Prices | Hovering around $100/brl | Near $80/brl, expected to rise |
| Current Account Deficit | Very high; >3% of GDP | Near $80/brl, expected to rise |
| FX Reserves and External Debt | Low reserves. High corporate FX debt due for maturity | FX reserves well above Total External Debt. Low Corporate FX leverage |
| Foreign Portfolio Flows | Bond Tourists Weak FDI | Long term real money flows / Strong FDI |
| Real Interest Rates | Deeply negative | Negative |
| Currency Valuation | Over-valued | Over-valued |
Source: Quantum Research
Outlook – Volatility Ahead
Bond markets have a lot to watch for in the coming few months. Monetary policy is in a transition mode in India and across the developed world. If history is any guide, these transitions from easing to tightening monetary policy tend to become chaotic with a lot of sentimental market movements on both sides. Thus, we should be prepared for increased level volatility in the bond market.
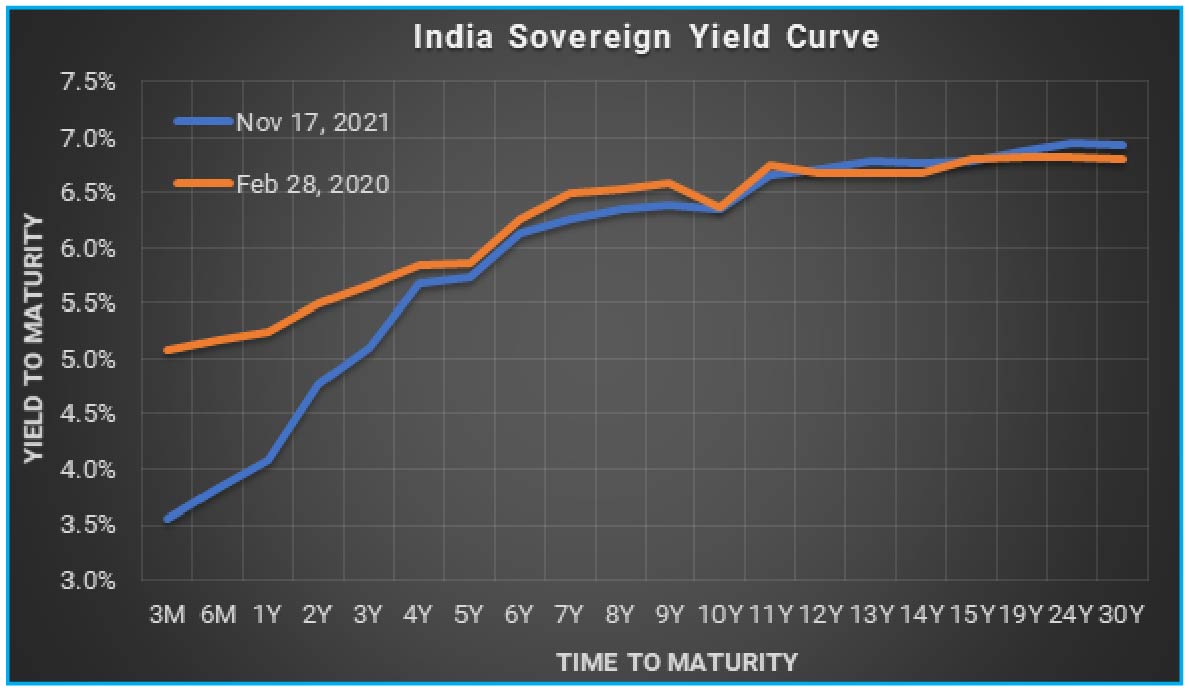
Although the macro backdrop is unfavourable, valuations at both the short and long end of the curve are at comfortable levels. We particularly like the 3-5 years segment of the government bonds which in our opinion is already pricing much of the liquidity normalisation and a start of rate hiking cycle by end of this year. Given the steep bond yield curve, 3-5 years bonds also offer the best roll down potential and thus a reasonable margin of safety in the rising rate environment.
The front end (up to 2 years maturity) yields should face the maximum impact of the rate hikes and yields should move higher in this segment.
At the longer maturity segment, current yield levels look good from a perspective that the terminal repo rate in this cycle may remain much below its pre-pandemic normal level. However, rising crude oil prices and absence of assured RBI buying coupled with high duration impact have raised the risk level in this segment. In the near term, crude oil price is a key variable to watch for this segment.
Chart – VI: India Sovereign Yield Curve is steepest in a decade
Source - Refinitiv, Quantum Research; Data as of November 17, 2021.
Past Performance may or may not sustained in future.
We will also be watchful of the developments on the global bond index inclusion of Indian bonds. With much of preparatory work having already been done, an announcement on the index inclusion could come as soon as early next year.
As per estimates this would attract USD 30-40 billion of inflows in the first year itself and will open up a consistent demand source for the Indian government bonds. (Read Will Foreigners Bond with India)
Portfolio Allocation - Balanced and Dynamic
Given the above-market view and need for balanced risk exposure, Quantum Dynamic Bond Fund (QDBF) is currently positioned at the 2–5-year part of the yield curve. Given our view of increase in volatility, we will remain vigilant to make tactical adjustments to the portfolio whenever required.
We continue to seek opportunities in the longer end bonds for a tactical trading position. Given the expectation that the terminal Repo Rate in this cycle will be much lower than the pre-pandemic normal (refer Investing in the New Normal), valuations do look attractive even at current levels. However, in the current environment with rising crude oil prices and lesser RBI support these bonds carry very high risk. We would wait for some of these risks to subside before taking a position in the longer end bonds.
We understand that the economy and markets are currently adjusting to an unprecedented shock. There are too many moving parts and things are still evolving. Thus, any forecast about the future is susceptible to change based on policy responses from the government and the RBI and changes in global markets.
We stand vigilant to review our outlook as and when new information comes. We retain our right to remain dynamic in our portfolio construction to respond to the evolving economic and market conditions.
For any queries directly linked to the insights and data shared in the newsletter, please reach out to the author – Pankaj Pathak, Fund Manager – Fixed Income at [email protected].
For all other queries, please contact Neeraj Kotian – Area Manager, Quantum AMC at [email protected] / [email protected] or call him on Tel: 9833289034
*Information referred above are illustrative and not recommendation of Quantum Mutual Fund/AMC. The Fund may or may not have any present or future positions in bond / stock of the above company. The above information of yield curve which is already available in publically access media for information and illustrative purpose only and not an endorsement / views / opinion of Quantum Mutual Fund /AMC. The above information should not be constructed as research report or recommendation to buy or sell of stock/ bond. Past Performance may or may not be sustained in future.
| Name of the Scheme | This product is suitable for investors who are seeking* | Riskometer |
| Quantum Liquid Fund An Open Ended Liquid Scheme | • Income over the short term • Investments in debt / money market instruments | 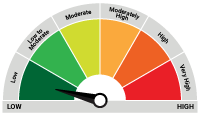 Investors understand that their principal will be at Low Risk |
| Quantum Dynamic Bond Fund An Open Ended Dynamic Debt Scheme Investing Across Duration | • Regular income over short to medium term and capital appreciation • Investment in Debt / Money Market Instruments / Government Securities | 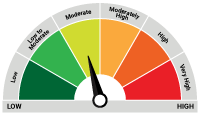 Investors understand that their principal will be at Moderate Risk |
The Risk Level of the Scheme in the Risk O Meter is based on the portfolio of the scheme as on October 31, 2021.
Disclaimer, Statutory Details & Risk Factors:
The views expressed here in this article / video are for general information and reading purpose only and do not constitute any guidelines and recommendations on any course of action to be followed by the reader. Quantum AMC / Quantum Mutual Fund is not guaranteeing / offering / communicating any indicative yield on investments made in the scheme(s). The views are not meant to serve as a professional guide / investment advice / intended to be an offer or solicitation for the purchase or sale of any financial product or instrument or mutual fund units for the reader. The article has been prepared on the basis of publicly available information, internally developed data and other sources believed to be reliable. Whilst no action has been solicited based upon the information provided herein, due care has been taken to ensure that the facts are accurate and views given are fair and reasonable as on date. Readers of this article should rely on information/data arising out of their own investigations and advised to seek independent professional advice and arrive at an informed decision before making any investments.
Mutual fund investments are subject to market risks read all scheme related documents carefully.
Please visit – www.quantumamc.com/disclaimer to read scheme specific risk factors. Investors in the Scheme(s) are not being offered a guaranteed or assured rate of return and there can be no assurance that the schemes objective will be achieved and the NAV of the scheme(s) may go up and down depending upon the factors and forces affecting securities market. Investment in mutual fund units involves investment risk such as trading volumes, settlement risk, liquidity risk, default risk including possible loss of capital. Past performance of the sponsor / AMC / Mutual Fund does not indicate the future performance of the Scheme(s). Statutory Details: Quantum Mutual Fund (the Fund) has been constituted as a Trust under the Indian Trusts Act, 1882. Sponsor: Quantum Advisors Private Limited. (liability of Sponsor limited to Rs. 1,00,000/-) Trustee: Quantum Trustee Company Private Limited. Investment Manager: Quantum Asset Management Company Private Limited. The Sponsor, Trustee and Investment Manager are incorporated under the Companies Act, 1956.
Related Posts
-

The Monetary Transition
Posted On Wednesday, Nov 24, 2021
Inflation has been one of the biggest talking points globally in 2021.
Read More -

सौरभ गुप्ता द्वारा मन्थ्ली इक्विटी देखें
Posted On Friday, Sep 17, 2021
एसएंडपी बीएसई सेंसेक्स अगस्त-21 के महीने में कुल रिटर्न के आधार पर 9.4% बढ़ा।
Read More -

निश्चित आय मासिक कमेंट्री - सितंबर 2021
Posted On Friday, Sep 17, 2021
बॉन्ड मार्केट के लिए अगस्त एक सकारात्मक महीना था। मैच्योरिटी कर्व के दौरान बांड यील्ड नीचे आया।
Read More


