Equity Outlook - June 2026
Posted On Monday, Jun 01, 2026

Markets were marginally higher in the month of May. Following table shows the change in broad market cap indices. On the global front, the US (S&P 500 Index) & Emerging Market Index continues to outperform Indian Indices.
Table 1: Performance of Major Indices during the Month
| Domestic Indices | 1 Month | 1 Year | 3 Year | 5 Year | 10 Year |
| BSE 500 | -0.1 | 0.1 | 46.5 | 79.4 | 274.8 |
| BSE 200 | -0.5 | -0.5 | 43.7 | 75.3 | 266.6 |
| BSE SENSEX | -2.5 | -7.0 | 24.1 | 53.7 | 219.5 |
| BSE MidCap | 1.7 | 4.7 | 78.0 | 126.9 | 359.6 |
| BSE SmallCap | 2.5 | 1.8 | 77.4 | 133.7 | 420.2 |
| S&P 500 | 5.2 | 43.9 | 116.5 | 153.6 | 503.9 |
| MSCI EM | 9.7 | 72.0 | 128.1 | 92.3 | 306.0 |
Source: Bloomberg, Data as of 31st May 2026.
Past performance may or may not be sustained in the future.
Earnings Trends Have Improved in the quarter gone by; West Asia Crisis is a Headwind
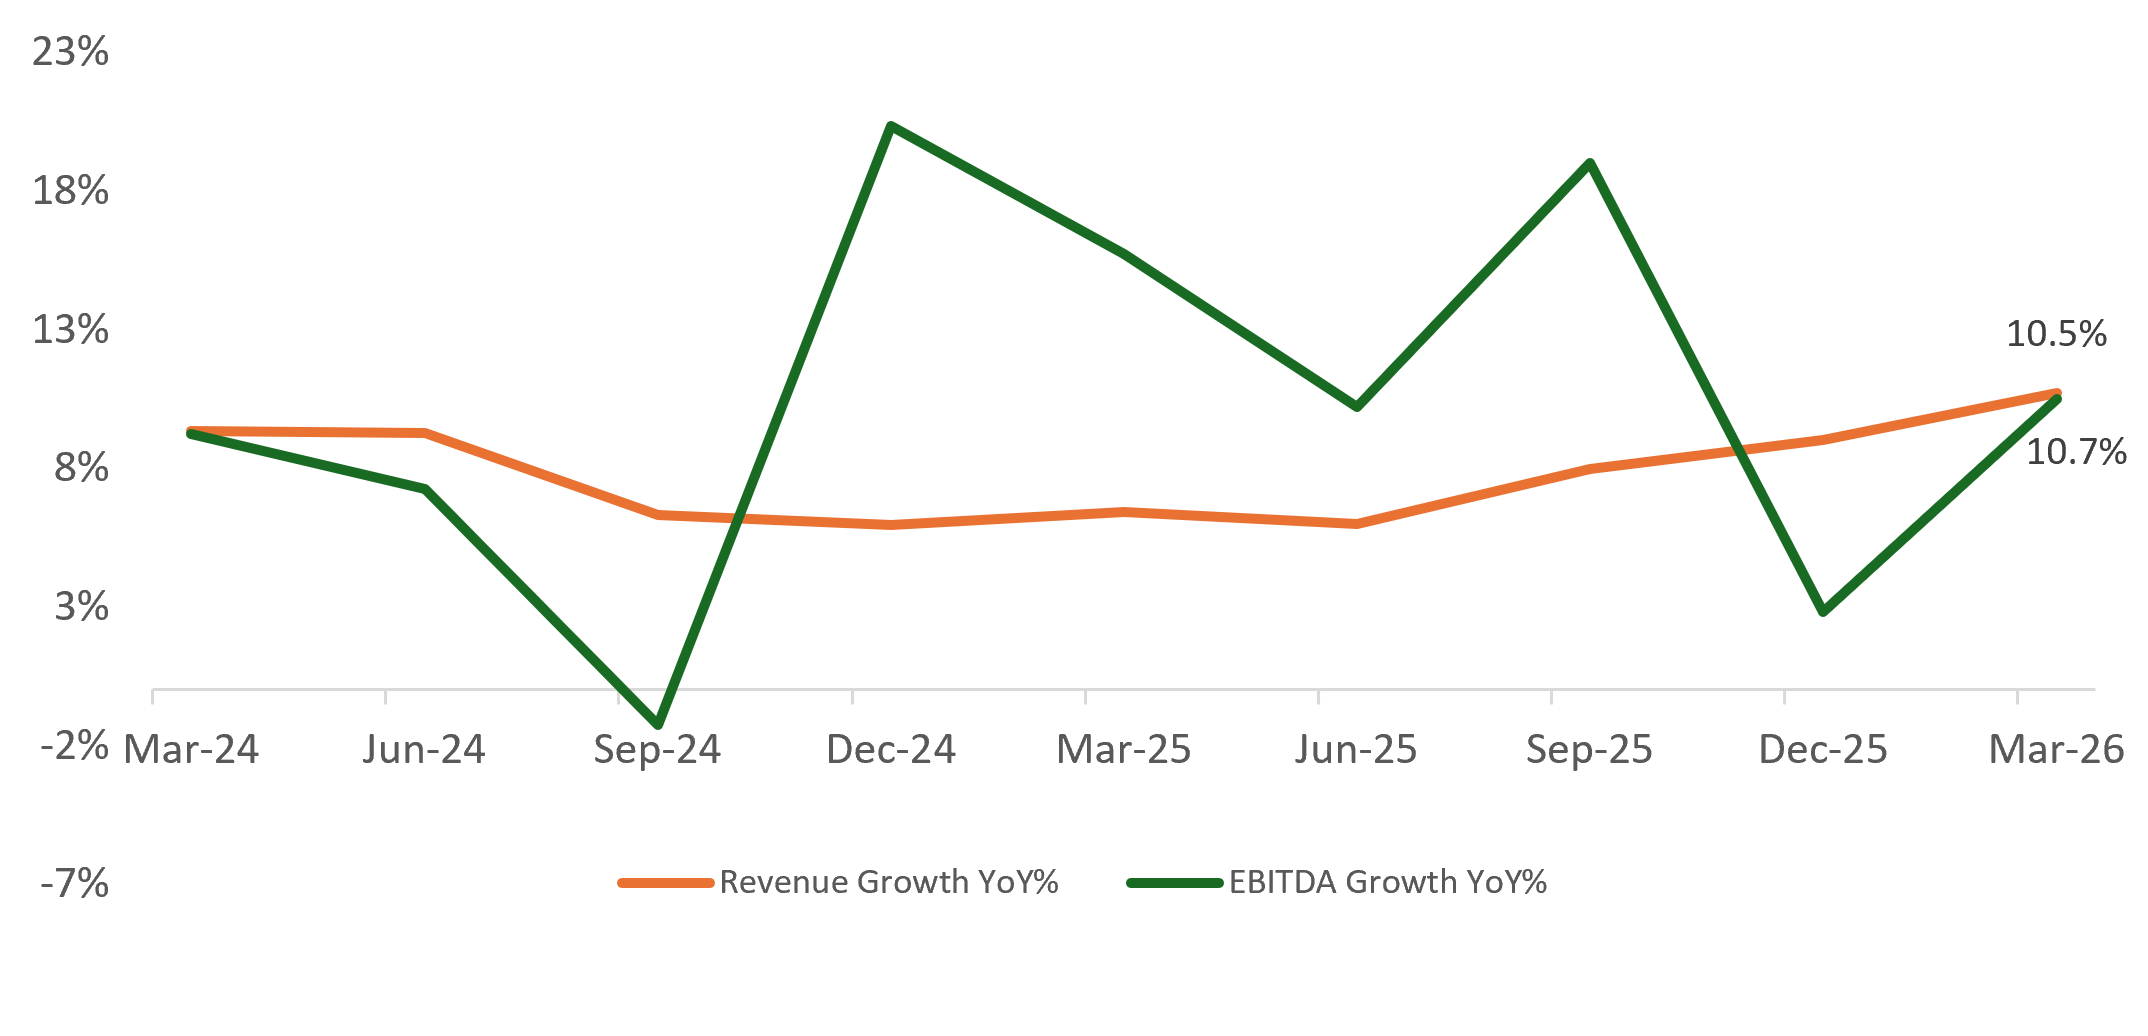
Source: Ace-Equity, BSE 500 Index. Data as on 31st May 2026.
Of the companies (BSE 500 Index) that have reported, the Revenue and EBITDA growth has improved to 10.7% and 10.5% YoY% respectively. The growth was driven by Metals, Consumer Durables, lending companies, OMC and FMCG. IT Services, select Realty and Pharma were a drag to EBITDA growth. These numbers factor in very limited impact of West Asia crisis; as the war started in March 2026.
In the near term, we believe the market may be driven by:Hope of West Asia crisis resolving. We are already into the fourth month of this crisis. India imports close to 80% of its energy needs; and prolonged war will weigh on India’s economic growth.
Earnings trend, which currently may look reasonable. Even, forward FY27E EPS growth for BSE 500 is 17.5% as of 31st May 2026. But there is limited pass through of input cost due to West Asia crisis in the number. Most of the companies that we track are calling out the input cost headwinds. Thus, as we progress through the year, earnings may get downgraded. Some of the key sectors that may see this impact are cement, autos, capital goods and chemicals.
The past 2 years have been good for the rural economy; primarily driven by good monsoons. Meteorological department is anticipating a year of poor monsoons driven by El Nino. This will have an impact on inflation, rural incomes and consumption. We are currently at the end of Monetary Easing Cycle with large rate cuts in the past year. If inflation moves higher, interest rates may move higher, which will be a headwind for growth.
Trajectory of FPI Investment: DII (Domestic Institutional Investors) inflows at USD 8.6bn continues to outpace FPI (Foreign Portfolio Investors) outflows of -USD 2.6bn. YTD FII selling has increased to -USD 23bn. Foreign portfolio investor’s interest in India is driven by EPS growth (compared to other EM), currency stability and global interest rates.
What can an Investor Do?
Though near-term earnings trend is linked to global developments, valuations have become conducive in many pockets (Refer Table 2). While short-term disruptions would have a bearing on near-term market movements, the impact on the intrinsic value of companies would be limited. Investors may consider staggered allocation to equities to take advantage of favorable valuations and benefit from the near-term potential volatility.
Table 2: Current Vs Historic Valuations of major indices
| 10y Median | ||||
| Index | P/E Ratio | P/B Ratio | P/E | P/B |
| BSE SENSEX | 21.0 | 3.0 | 23.9 | 3.3 |
| BSE 100 | 21.5 | 3.0 | 24.0 | 3.4 |
| BSE 250 SmallCap | 33.3 | 3.1 | 32.0 | 2.4 |
| BSE MidCap | 28.8 | 3.7 | 30.5 | 2.9 |
| BSE 500 | 23.6 | 3.1 | 25.3 | 3.2 |
Source: Bloomberg; P/E: Price to Earnings; P/B: Price to Book; Data as of 31st May 2026
Past performance may or may not be sustained in the future.
 |
|
View All
Related Posts
-

Equity Outlook - July 2026
Posted On Wednesday, Jul 01, 2026
Indian equities recovered in the month of June, as the West Asia crisis showed signs of de-escalation.
Read More -

Equity Outlook - June 2026
Posted On Monday, Jun 01, 2026
Markets were marginally higher in the month of May. Following table shows the change in broad market cap indices.
Read More -

Equity Outlook - May 2026
Posted On Monday, May 04, 2026
Markets rebounded sharply from the lows of March after announcement of ceasefire. Following table shows the change in broad market cap indices.
Read More

