Gold Outlook - July 2026
Posted On Wednesday, Jul 01, 2026
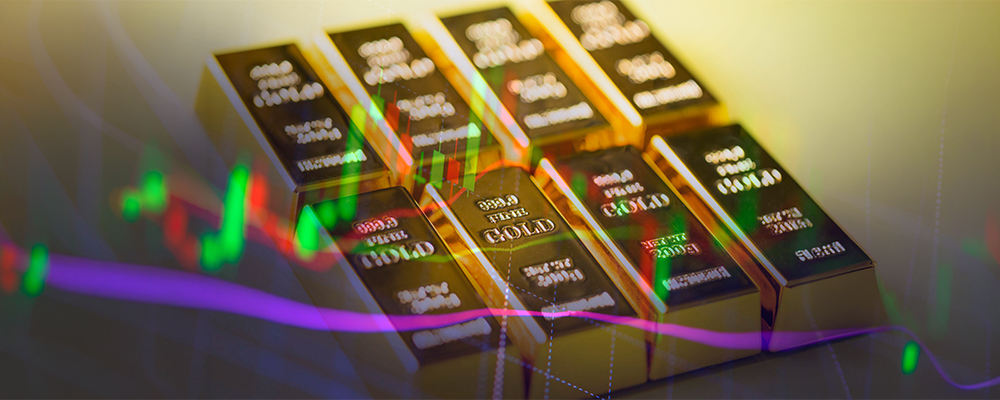
The Hawk, the Hormuz and the Hold: Gold's June Reckoning
June 2026 Performance: Gold Breaches $4,000 as Rate and Risk Premiums Unwind Together
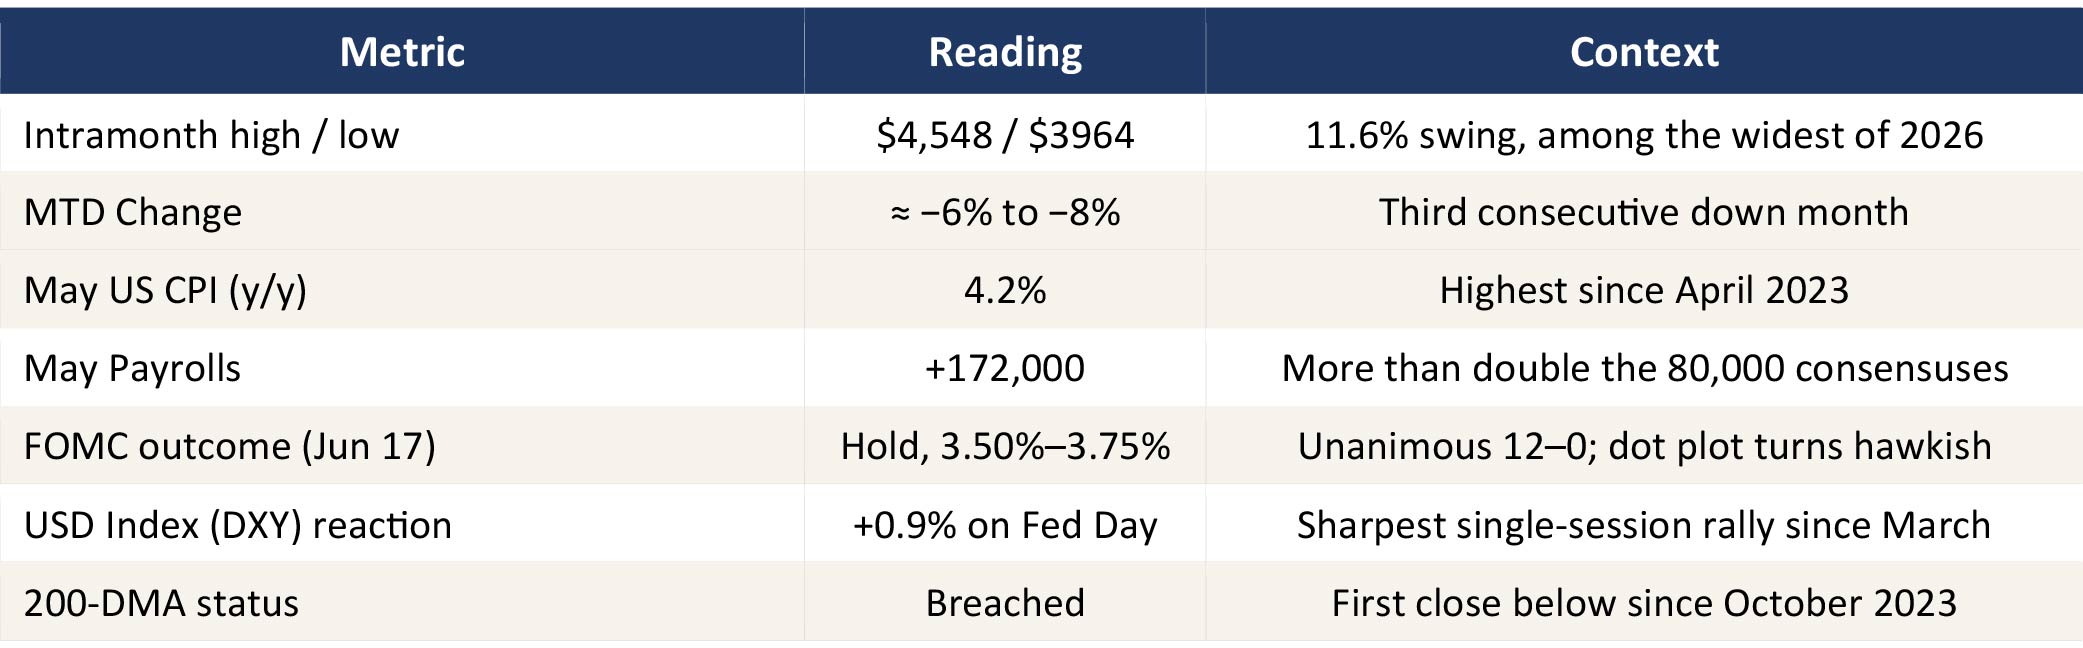
June closed out with gold breaching the $4,000/oz1 mark for the first time since November 2025. The move capped a reversal that built steadily through June, standing in sharp contrast to May's far quieter tone. Prices held within a comparatively narrow band as markets withheld conviction on two unresolved questions: whether the Iran ceasefire would hold, and whether the Fed's policy path had genuinely turned. June supplied an answer to both, and on each count the resolution worked against gold.
Early June saw gold attempts a recovery toward $4,3801 on lingering scepticism about the durability of the Iran ceasefire, only to be punished twice in quick succession: first by a blow-out May payrolls print, and then by the Federal Reserve's June 17 decision. Though, FED officials held rates unchanged, but they signalled growing committee support for further hikes, with nine of nineteen FOMC members projecting at least one additional increase before year end and new Fed Chair Kevin Warsh reaffirming his focus on restoring price stability. Each event chipped away the rate-cut optionality that had underwritten gold's rally since late 2025. Crucially, this was not a single-cause correction, it was two shocks reinforcing one mechanism: rising real yields. The de-escalation of the Iran war removed roughly half of the geopolitical risk premium that had been baked into prices since February, while a resilient labour market and sticky inflation removed the other half of the rate-cut premium. Gold, in effect, was correcting for the absence of two tailwinds simultaneously rather than confronting any new structural headwind.
By the close of the month, both supports had given way together. The Dollar Index pushed to its highest level since May 2025 and fed funds futures implied close to a three in four probability of a rate hike in September. Taken together, June's close leaves gold roughly 29% below its January peak of $5,589/oz1, unwinding a meaningful share of this cycle's advance within five months even as the metal remains higher year on year.
Source – Bloomberg, Quantum Research.
What Drove the Move: Untangling Geopolitics, the Fed, and Flows
→ Kevin Warsh's Fed Debut Reframed the Rate Path -
At his first meeting as Chair on June 17, Warsh left rates unchanged at 3.50%–3.75% but delivered a distinctly hawkish message: the median 2026 rate projection rose to 3.8% from 3.4%, nine of eighteen officials now expect at least one rate hike in 2026, and the policy statement was sharply shortened, stripping out easing language2. Against a backdrop of resurgent inflation in May accelerated to 4.2% y/y, the highest since April 2023, driven by a 23.5% surge in energy prices linked to the Iran conflict and a resilient labour market, with May payrolls rising 172,000, more than double expectations, markets rapidly repriced the path of policy3. The dollar posted its strongest one-day rally since March, while gold reversed from an intraday high near $4,380 to close roughly 1.6% lower1, with most of the decline occurring before Warsh even spoke. Further reinforcing the shift, Warsh withheld his own dot projection and launched five task forces to overhaul Fed operations, including the September framework itself, signalling a quieter, more data-driven policy regime that could shape gold volatility patterns through 2027.
→ Central Bank Flows Confirms the Story -
Patient Capital Stayed - Positioning data reinforces the read that this was a tactical unwind rather than a capitulation. Global gold ETFs entered June with holdings of 4,121 tonnes and AUM near $604bn, just below February's record of 4,176 tonnes after May in which net outflows were a modest $2bn against a backdrop of risk-on rotation into technology equities4. Central banks, by contrast, kept buying: a net 244 tonnes in Q1 2026 followed by a further 10 tonnes in May, with China extending its accumulation streak past eighteen consecutive months5.
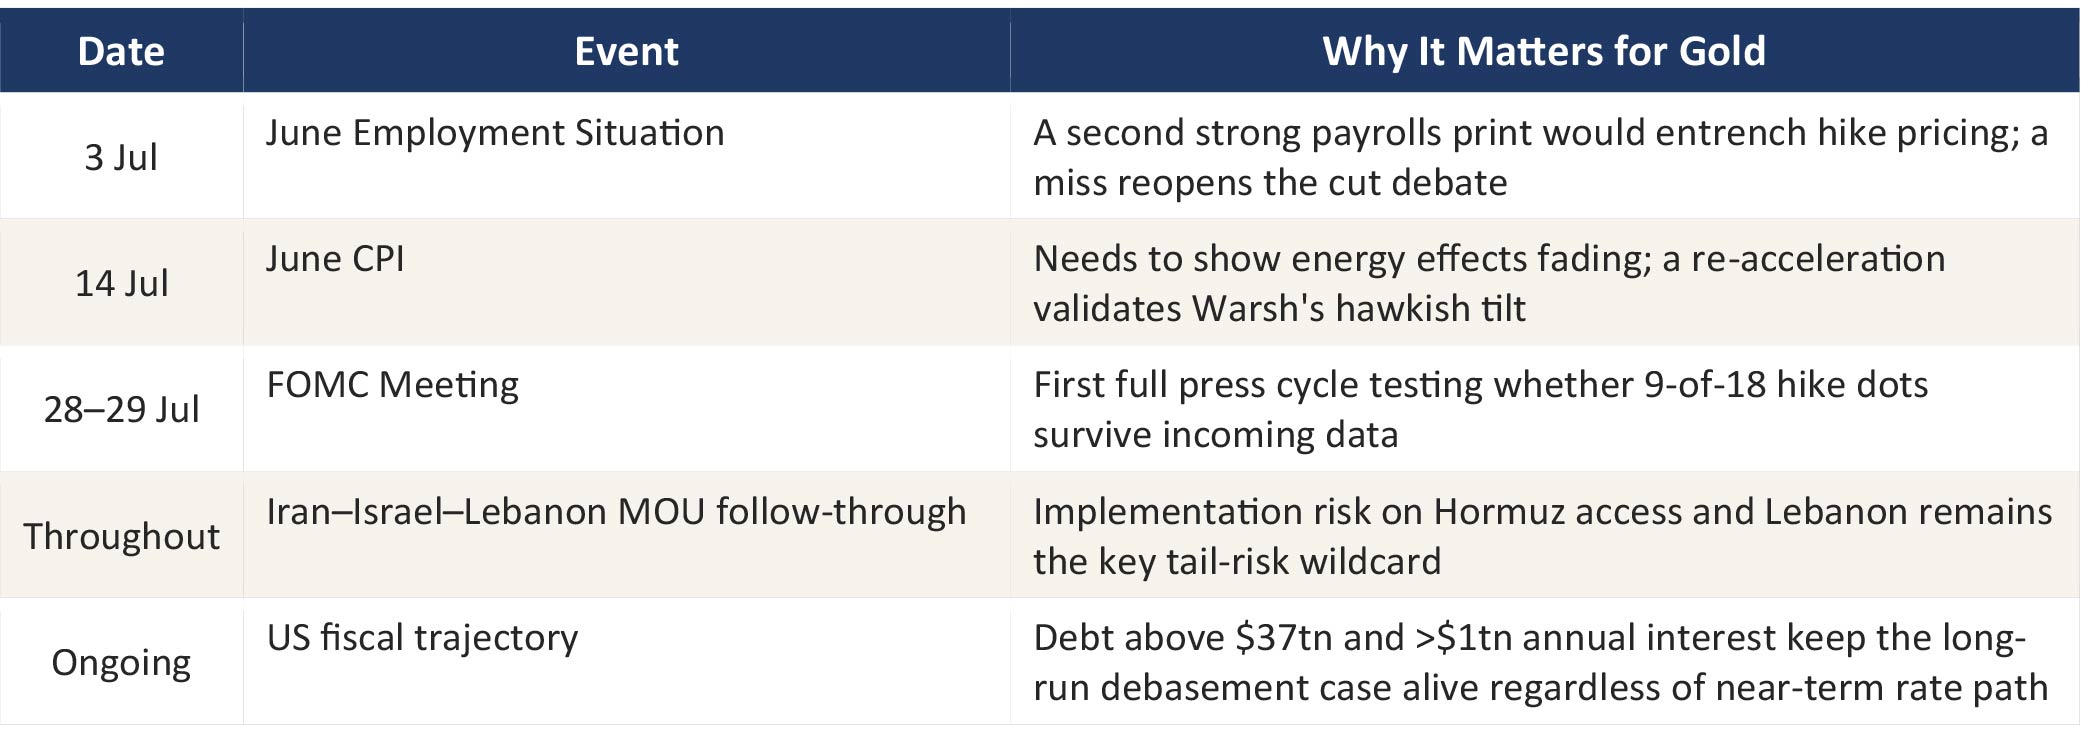
Looking Ahead to July: Triggers, Tensions and the Path of Least Resistance
July inherits an unusually dense and consequential calendar for a month that, on the old seasonal playbook, was supposed to be quiet. Investors should treat the next four weeks as a sequence of binary tests for the hawkish narrative the Fed set in June, rather than a single directional bet.
Three Forces in Tension
→ Rates versus reality: Markets and the Fed's own dot plot have converged on a possible 2026 hike, but consensus among major desks still leans toward the energy-driven inflation spike fading by Q3, implying July's CPI print is the single most consequential data point of the quarter for gold.
→ Geopolitical fragility: The Iran MOU is a 60-day framework, not a final settlement, and unresolved friction in Lebanon and over Hormuz inspections means a single violation headline could restore a meaningful chunk of the war premium gold shed in June.
→ Seasonal jewellery lull versus structural bid: July is traditionally the weakest month for Asian jewellery fabrication ahead of the autumn restocking cycle, but this seasonal drag has been consistently overwhelmed in 2025–26 by central-bank accumulation and bar-and-coin demand
Key Data to Lookout for –
Source – Bloomberg, Quantum Research.
Conclusion: Reading Gold Through the Lens of Narrative Decay, Not Just Real Yields
The conventional lens on June's correction is the right one as far as it goes: real yields rose, dollar strengthened, two premiums unwound, gold fell. A second, less-discussed way to read the same data may matter more for July: treat gold's 2026 cycle not as one trade but as three overlapping 'stories' priced simultaneously, a war story, a Fed-transition story, and a debasement story. Each has its own half-life, and June was the month the first two visibly decayed together, even as the third did not.
The war story decayed because ceasefires are real news; the Fed-transition story decayed because Warsh's hawkish debut answered the market's biggest open question about who he is. But the debasement story, eighteen straight months of central-bank buying gold4, $37 trillion of US federal debt generating over $1 trillion in annual interest6, and a Fed chair openly redesigning how the institution communicates, has not decayed at all. It has arguably been reinforced by the fiscal mechanics that genuine tightening would expose.
The recent weakness in gold is consistent with this framework. Expectations of further Fed rate hikes have pushed real US interest rates higher and flattened the US yield curve, placing downward pressure on the gold price. Historically, however, such pressure has tended to ease once markets conclude that policy has become sufficiently restrictive. Our view remains that the Fed's next move is ultimately more likely to be a rate cut than a sustained hiking cycle. Even if the Fed were to raise rates again in the coming months, it could quickly become apparent that the move was a policy mistake, necessitating another pivot. As expectations shift from further tightening towards eventual easing, the headwind from higher real rates should begin to fade, allowing gold to recover.
The practical takeaway: stop reading gold's swings purely as a referendum on the next rate decision. A July sell-off driven by strong jobs or CPI data is simply the rates story reasserting itself, the kind of dip that has attracted buyers throughout this cycle. A sell-off driven by slowing central-bank purchases, or a fading debasement narrative among reserve managers, would be a more meaningful signal. Until those changes emerge, the broader bull case remains intact as the debasement chapter continues to be written.
Source : 1Bloomberg, 2Federal Reserve FOMC Statement – 17th June 2026, 3U.S. Bureau of Labor Statistics (BLS), 4World Gold Council (WGC), 5People's Bank of China (PBOC) - State Administration of Foreign Exchange (SAFE), 6U.S. Government Accountability Office (GAO).
 |
Disclaimer, Statutory Details & Risk Factors:The views expressed here in this article are for general information and reading purpose only and do not constitute any guidelines and recommendations on any course of action to be followed by the reader. Quantum AMC / Quantum Mutual Fund is not guaranteeing / offering / communicating any indicative yield on investments made in the scheme(s). The views are not meant to serve as a professional guide / investment advice / intended to be an offer or solicitation for the purchase or sale of any financial product or instrument or mutual fund units for the reader. The article has been prepared on the basis of publicly available information, internally developed data and other sources believed to be reliable. Whilst no action has been solicited based upon the information provided herein, due care has been taken to ensure that the facts are accurate and views given are fair and reasonable as on date. Readers of this article should rely on information/data arising out of their own investigations and advised to seek independent professional advice and arrive at an informed decision before making any investments. Mutual Fund investments are subject to market risks, read all scheme related documents carefully. |
View All
Related Posts
-
Gold Outlook - July 2026
Posted On Wednesday, Jul 01, 2026
June closed out with gold breaching the $4,000/oz1 mark for the first time since November 2025. The move capped a reversal that built steadily through June, standing in sharp contrast to May's far quieter tone.
Read More -

Gold Outlook - June 2026
Posted On Monday, Jun 01, 2026
May 2026 has been a tale of two forces for gold, the persistent macro headwinds of elevated energy prices
Read More -
Gold Outlook - May 2026
Posted On Monday, May 04, 2026
Gold entered April 2026 on tentative footing after its sharpest monthly correction in over a decade in March.
Read More

