Debt monthly view for December 2021
Posted On Tuesday, Jan 11, 2022
The Indian Bond Markets have been mollycoddled over the last three years by the incredible actions of the Central Bank.
The Reserve Bank of India (RBI) cut interest rates, eased liquidity, and bought record amounts of government bonds to anchor market interest rates at low levels.
The bond market embraced this arrangement and never second-guessed the RBI’s guidance despite rising inflation and a higher bond supply due to a blown-out government balance sheet.
This was a cozy symbiotic relationship; not only in India, but around the world. That though is about to change.
As growth recovers and inflation rages, the Central bank, not only in India but from around the world will not only raise interest rates but will also reduce its liquidity support to the bond markets.
The possible divergence in the timing, the extent and the pace of the actions will be the key driver for the bond markets in 2022.
Misunderstandings are likely to creep into this symbiotic relationship. Trust will be at a premium. Divergent viewpoints will lead to volatility.
We expect considerable volatility in the Indian bond market in the coming 6-9 months due to:
1. How have the asset classes performed in the year 2021?
2. What are their expectations from each asset class in the year 2022?
3. How can you build a strong portfolio to withstand uncertainty and build wealth?
Divergence on Inflation assessment
“I think it's probably a good time to retire that (transitory) word and try to explain more clearly what we mean.” – US Federal Reserve Chairman Jerome Powell, statement at a Congressional hearing.
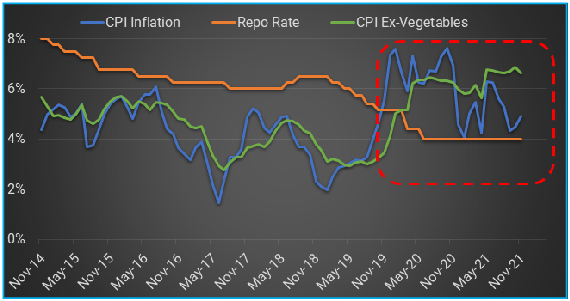
In India, the consumer price inflation (CPI) averaged 5.96% in the last 24 months (December 2019-November 2021) as against an average of 4.1% in the preceding 5 years (December 2014-November 2019).
Although the last three readings of headline CPI inflation were lower between 4%-5% (4.35%, 4.48% and 4.91% in September, October and November 2021, respectively), it was largely due to base effect from high CPI reading during the same months of last year (7.27%, 7.61% and 6.93% respectively in Sep, Oct and Nov 2020).
Much of this distortion in inflation numbers was caused by a sharp rise and fall in vegetable prices. The ex-vegetable inflation, which constitutes about 94% of the CPI basket, stood between 6.64%-6.87% during the last three months; and for the last 12 months, it averaged at 6.4%. This is not just significantly higher than the RBI’s inflation target of 4%, it is also holding above the RBI inflation tolerance band of 2%-6%.
Evidently, inflation has been a lot more persistent over the last two years and there is no clear sign of it coming down in 2022. We see headline CPI inflation moving higher (possibly above 6%) in the coming months as the base effect fades away.
Furthermore, telecom and electricity tariff hikes, the proposed increase in GST rate on apparels and general increase in prices of goods across various categories will continue to put upward pressure on the inflation trajectory. We are also seeing services inflation picking up gradually and as services demand gains momentum, it could drive inflation even higher.
Despite the elevated inflation trend, the RBI was surprisingly dovish in its monetary policy statement on December 8, 2021. It downplayed the inflation risk and continued to prioritize growth over inflation. The governor said – “we remain committed to our stance in support of our overarching priority at this juncture to broaden the growth impulses while preserving monetary and financial stability.”There was no indication of change in stance or potential rate increases anytime soon.
Chart – I: Inflation Holding above the Repo Rate
Source: MOSPI, RBI, Quantum Research, | Data up to November 2021
However, just as the US FED made a U-turn on inflation being transitory, we expect a similar change in tune from the RBI.
Global Inflation War
In the December meeting, the US Federal Reserve (FED) made a significant hawkish turn as they dropped the long-held narrative of inflation being transitory and characterized ‘high inflation as the biggest threat to full employment goal’.
They accelerated the pace of QE tapering (reduction of bond buying by the FED) from USD 15 billion/month to USD 30 billion/ month to end its QE program (bond purchase) by mid-March 2022. The faster withdrawal of the bond buying program is an indication that the FED will start the hiking rate very soon.
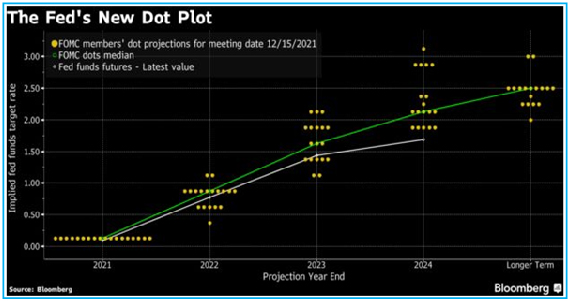
The ‘dot-plot’, which reflects the future interest rate expectations of the FOMC (interest rate setting committee of the US Federal Reserve) members now expect 3 rate hikes in 2022 and 2023 respectively.
Chart – II: FED’s Dot Plot indicating ‘faster rate hike’
Source – Bloomberg, December 2021
This is a clear change in stance by the FED. It also indicates that the economy is no longer in a crisis and that monetary policy need to move away from crisis time actions.
Divergent EXIT policies of global central banks
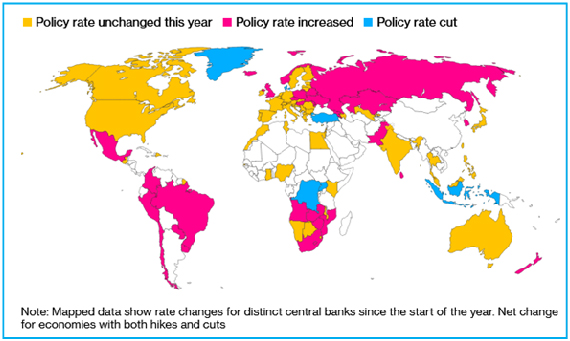
The FED was not alone. The Bank of England (BOE) also intensified its fight against inflation as it became the first G7 central bank to hike interest rates since the onset of the pandemic. The European Central Bank (ECB) also called for vigilance on inflation; however, it adopted a more gradual approach of policy normalization.
Chart - III: Changing Policy Landscape – More Rate hikes coming in 2022
Source – Bloomberg, December 2021
India in the World of Uncertainty
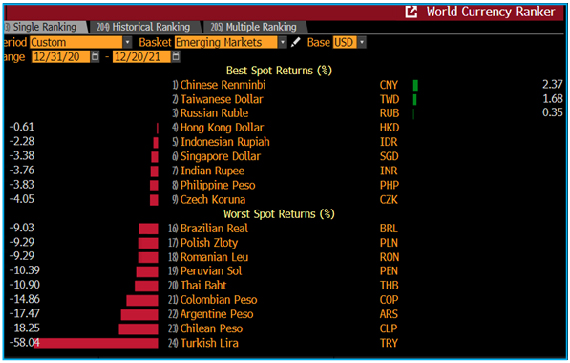
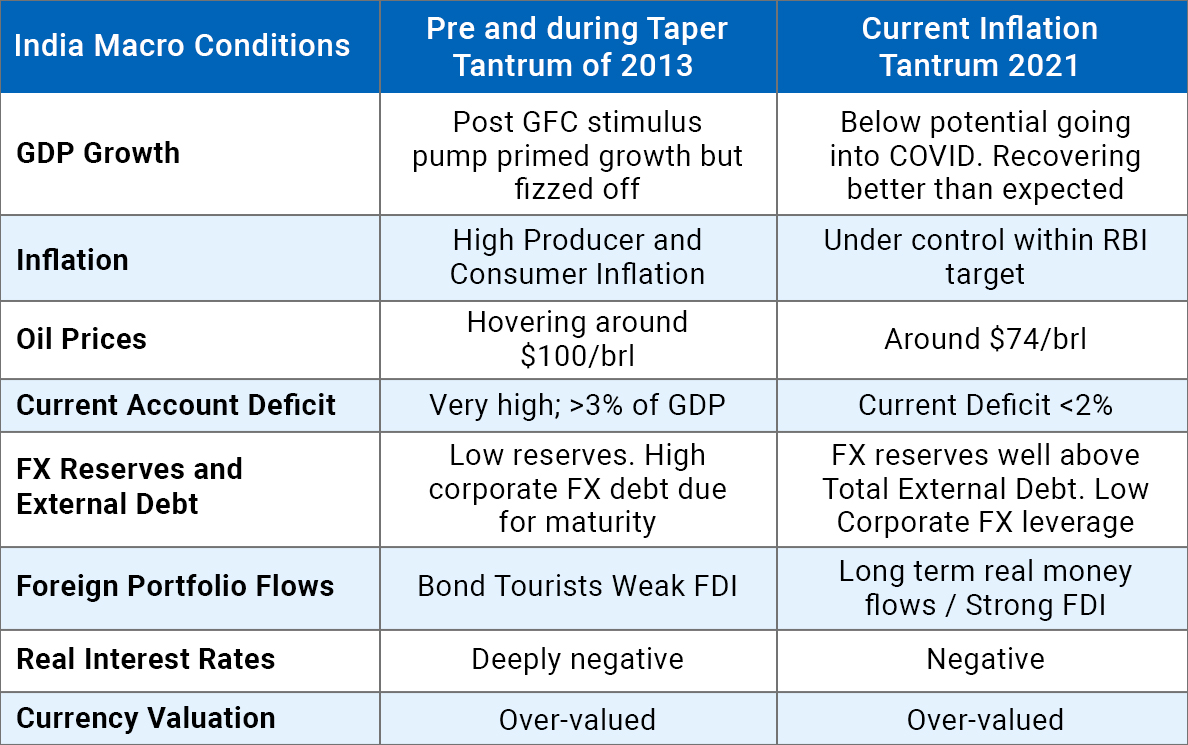
Changing global policy landscape has implications for emerging markets like India. Monetary tightening (liquidity withdrawals and rate hikes) in the developed world typically causes capital outflows from emerging markets (EM) and puts pressure on EM currencies and bonds.
EM countries with low/negative real interest rates (interest rates minus inflation rate), high debt levels and wide fiscal and current account balances are more vulnerable.
Chart – IV: Emerging market currencies lost value against US dollar in 2021
Source – Bloomberg, Data up to December 20, 2021
From a global perspective, India is lagging behind many of its emerging market peers in normalizing the monetary policy and hiking interest rates. Although we believe that India is not fragile anymore like it was in 2013, it will not be immune to external shocks caused by faster FED tightening. Thus, the RBI will be forced to change its stance and begin hiking interest rates sooner than they prefer.
Table - I: India not ‘Fragile’ anymore?
Source: Quantum Research
Globally, the biggest risk for the markets will stem from the US FED beginning to reduce the size of its balance sheet. This means that the US FED will be taking liquidity away from the markets.
The fact that this was discussed in the December FOMC meeting suggests that, if conditions persist, the FED may not only hike rates but also begin the process of allowing bonds that it holds to mature and/or selling bonds to reduce the size of its balance sheet.
This scenario is not priced in the markets and will be a big scare for risk assets especially in emerging markets that have benefited from global liquidity.
On the positive side, India is expected to be included in the global bond index sometime in 2022 as much of preparatory work has already been done. As per estimates, this would attract USD 30-40 billion of inflows in the first year itself and will open up a consistent demand source for the Indian government bonds. (Refer Will Foreigners Bond with India)
Divergent Yield Curve and Return Expectations.
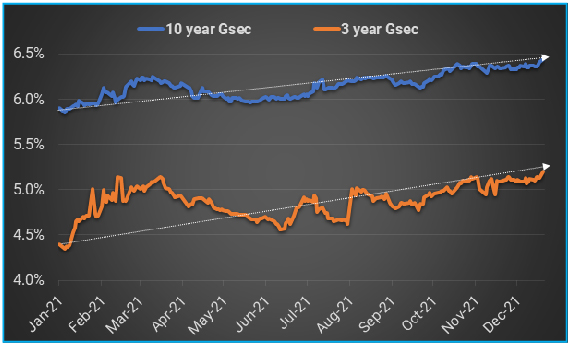
Markets have a tendency to run ahead of actual events. Since the start of 2021, bond yields have already risen a lot in expectation of liquidity tightening and eventual rate hikes. Thus, gradual rate increases which are well communicated will be absorbed comfortably. However, we may continue to see a gradual increase in short term yields as central banks increase rates and reduce liquidity.
Chart – V: Rate Hike Expectation Pushed Bond Yields Higher in 2021
Source – Bloomberg, Quantum Research, Data up to December 20, 2021.
Past Performance may or may not sustained in future.
Long term bond yields may remain range-bound around current levels or move up only marginally as we expect this rate hiking cycle to be much shallower with the RBI trying to keep the terminal repo rate closer to 5.0%-5.5% (Refer Investing in The New Normal). This assessment was based on the fact that much of domestic inflation is coming from supply chain disruptions and one-off price adjustments which should fade away over the period.
Long-term bond yields, though, face risks from a sudden change in stance from central banks. India faces this risk from an increase in oil prices or a rise in food prices. This would force the RBI to hike interest rates sharply and markets could face higher volatility.
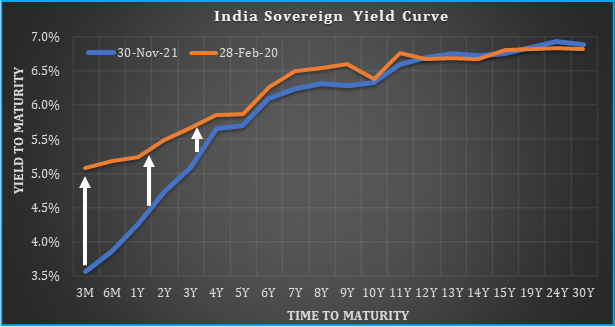
With the RBI hiking the policy repo rates and withdrawing its liquidity support to the market, money market rates should rise.
Chart – VI: Short term interest rates to move higher
Source: Refinitiv, Quantum Research, Data as of November 30, 2021
Past Performance may or may not sustain in future
2020 and early parts of 2021 saw returns on medium to long-term bonds/bond funds soaring as interest rates fell. At the same time, returns on overnight, liquid, money market funds fell.
The best way to play the rate hiking cycle is to focus on the short maturity segments of the market. Investors in liquid funds and money markets funds should see their returns improve as compared to bank savings accounts. Low market risk, cash equivalents seem to be the best option from a risk/return perspective.
Portfolio Allocation - Defensive and Dynamic
Although the macro backdrop is unfavourable (high inflation, monetary tightening), valuation in 2-5 years government bonds looks comfortable. In our opinion, this segment is already pricing much of the liquidity normalization (lowering of liquidity surplus) and a start of the rate hiking cycle by early next year.
Given the steep bond yield curve, 2-5 years bonds also offer the best roll-down potential and thus a reasonable margin of safety from rising bond yields. For instance, currently, the yield on the 5 years government bond is around 5.80% and that on the 4 years bond is at 5.58%. After one year, the current 5-year bond will have a residual maturity of 4 years. Assuming no change in market interest rates, the yield on the current 5-year bond should roll-down by 22 basis points to 5.35% in one year period.
The bulk of our holding in the Quantum Dynamic Bond Fund is in the 2-5 years maturity segment.
We recognize that the monetary policy is in a transition phase in India and across the world. If history is any guide, these transitions from easing to tightening monetary policy tend to become chaotic with a lot of sentimental and divergent market movements on both sides. Thus, we should be prepared for increased volatility in the bond market over the next few months. With this view, we are carrying higher than usual cash in the Quantum Dynamic Bond Fund portfolio to lower the impact of any adverse market movements.
We are closely monitoring the developments around the new Covid-19 variant and its impact on the monetary and fiscal policies. We stand vigilant to react and change the portfolio positioning in case our view on the market changes.
From investors’ perspective, we believe a combination of liquid to money market funds to benefit from the increase in interest rates in the coming months; along with an allocation to short term debt funds and/or dynamic bond funds with low credit risks should remain as the core fixed income allocation.
We suggest bond fund investors to have a longer holding period to ride through any intermittent turbulence in the market.
Source: Worldometer.info
*Information referred above are illustrative and not recommendation of Quantum Mutual Fund/AMC. The Fund may or may not have any present or future positions in bond / stock of the above company. The above information of yield curve which is already available in publically access media for information and illustrative purpose only and not an endorsement / views / opinion of Quantum Mutual Fund /AMC. The above information should not be constructed as research report or recommendation to buy or sell of stock/ bond. Past Performance may or may not be sustained in future.
| Name of the Scheme | This product is suitable for investors who are seeking* | Riskometer |
| Quantum Liquid Fund An Open-ended Liquid Scheme. A relatively low interest rate risk and relatively low credit risk. | • Income over the short term • Investments in debt / money market instruments | 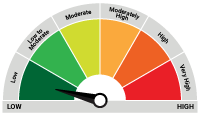 Investors understand that their principal will be at Low Risk |
| Quantum Dynamic Bond Fund An Open-ended Dynamic Debt Scheme Investing Across Duration. A relatively high interest rate risk and relatively low credit risk. | • Regular income over short to medium term and capital appreciation • Investment in Debt / Money Market Instruments / Government Securities | 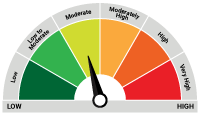 Investors understand that their principal will be at Moderate Risk |
The Risk Level of the Scheme in the Risk O Meter is based on the portfolio of the scheme as on December 31, 2021.
| Potential Risk Class Matrix - Quantum Liquid Fund | |||
| Credit Risk → | Relatively Low | Moderate (Class B) | Relatively High (Class C) |
| Interest Rate Risk↓ | |||
| Relatively Low (Class I) | A-I | ||
| Moderate (Class II) | |||
| Relatively High (Class III) | |||
| Potential Risk Class Matrix – Quantum Dynamic Bond Fund | |||
| Credit Risk → | Relatively Low | Moderate (Class B) | Relatively High (Class C) |
| Interest Rate Risk↓ | |||
| Relatively Low (Class I) | |||
| Moderate (Class II) | |||
| Relatively High (Class III) | A-III | ||
Disclaimer, Statutory Details & Risk Factors:
The views expressed here in this article / video are for general information and reading purpose only and do not constitute any guidelines and recommendations on any course of action to be followed by the reader. Quantum AMC / Quantum Mutual Fund is not guaranteeing / offering / communicating any indicative yield on investments made in the scheme(s). The views are not meant to serve as a professional guide / investment advice / intended to be an offer or solicitation for the purchase or sale of any financial product or instrument or mutual fund units for the reader. The article has been prepared on the basis of publicly available information, internally developed data and other sources believed to be reliable. Whilst no action has been solicited based upon the information provided herein, due care has been taken to ensure that the facts are accurate and views given are fair and reasonable as on date. Readers of this article should rely on information/data arising out of their own investigations and advised to seek independent professional advice and arrive at an informed decision before making any investments.
Mutual fund investments are subject to market risks read all scheme related documents carefully.
Please visit – www.quantumamc.com/disclaimer to read scheme specific risk factors. Investors in the Scheme(s) are not being offered a guaranteed or assured rate of return and there can be no assurance that the schemes objective will be achieved and the NAV of the scheme(s) may go up and down depending upon the factors and forces affecting securities market. Investment in mutual fund units involves investment risk such as trading volumes, settlement risk, liquidity risk, default risk including possible loss of capital. Past performance of the sponsor / AMC / Mutual Fund does not indicate the future performance of the Scheme(s). Statutory Details: Quantum Mutual Fund (the Fund) has been constituted as a Trust under the Indian Trusts Act, 1882. Sponsor: Quantum Advisors Private Limited. (liability of Sponsor limited to Rs. 1,00,000/-) Trustee: Quantum Trustee Company Private Limited. Investment Manager: Quantum Asset Management Company Private Limited. The Sponsor, Trustee and Investment Manager are incorporated under the Companies Act, 1956.
Related Posts
-

Debt Monthly for February 2026
Posted On Monday, Feb 02, 2026
In FYTD26, Indian bond yields defied expectations, firming up even as monetary policy turned supportive.
Read More -

Debt Monthly for January 2026
Posted On Thursday, Jan 01, 2026
Navigating 2026: India’s Bond Market in a Changing Global Landscape
Read More -

Debt Monthly for December 2025
Posted On Tuesday, Dec 02, 2025
As we approach the end of the calendar year, we find ourselves at a pivotal moment, with the market split on the likelihood of an upcoming rate cut.
Read More


