Equity Monthly for July 2025
Posted On Monday, Jul 07, 2025

The market continued the upward trajectory with BSE Sensex gaining by 3.0%. The BSE mid and small cap indices rose by 3.9% and 4.4% respectively. Major events for the market during the month were RBI rate cut and a moderation in middle east tensions. On the global front, Fed continued the “wait and see” mode, wary of potential inflation pressure due to tariffs. Going by the recent turn of events, the U.S. tariffs are unlikely to be materially worse than market expectations.
The equity markets for the month were driven by an easing of global geopolitical tension and a larger than expected rate cut by RBI. The central bank has front loaded the interest rate cuts with a higher than expected repo rate cut of 50 bps in the recent policy review (cumulative rate cut of 100 bps over a span of six months), citing declining trend of inflation and need to boost domestic consumption. It has also announced a CRR cut (Cash Reserve Ratio: Share of bank’s total deposits which need to be parked with RBI at zero interest) of 100 bps in a staggered manner. It has also announced a relaxation of project financing provision norms effective October 1,2025. All these measures would aid in better credit availability and liquidity in the system.
As can be seen in the below chart, demand environment (Refer Sales Growth) remains muted in recent quarters. Interest rate cut, contained inflation, reasonable progress in monsoon and income tax rebate announced in recent budget are expected to leave more disposable income in the hands of consumers, supporting consumption in the medium term. Apart from these, the base number in FY25 is subdued, which could lead to reasonable growth in the medium term.
Graph 1: Aggregate Sales Growth & PBIDT Margin of BSE 500 Index
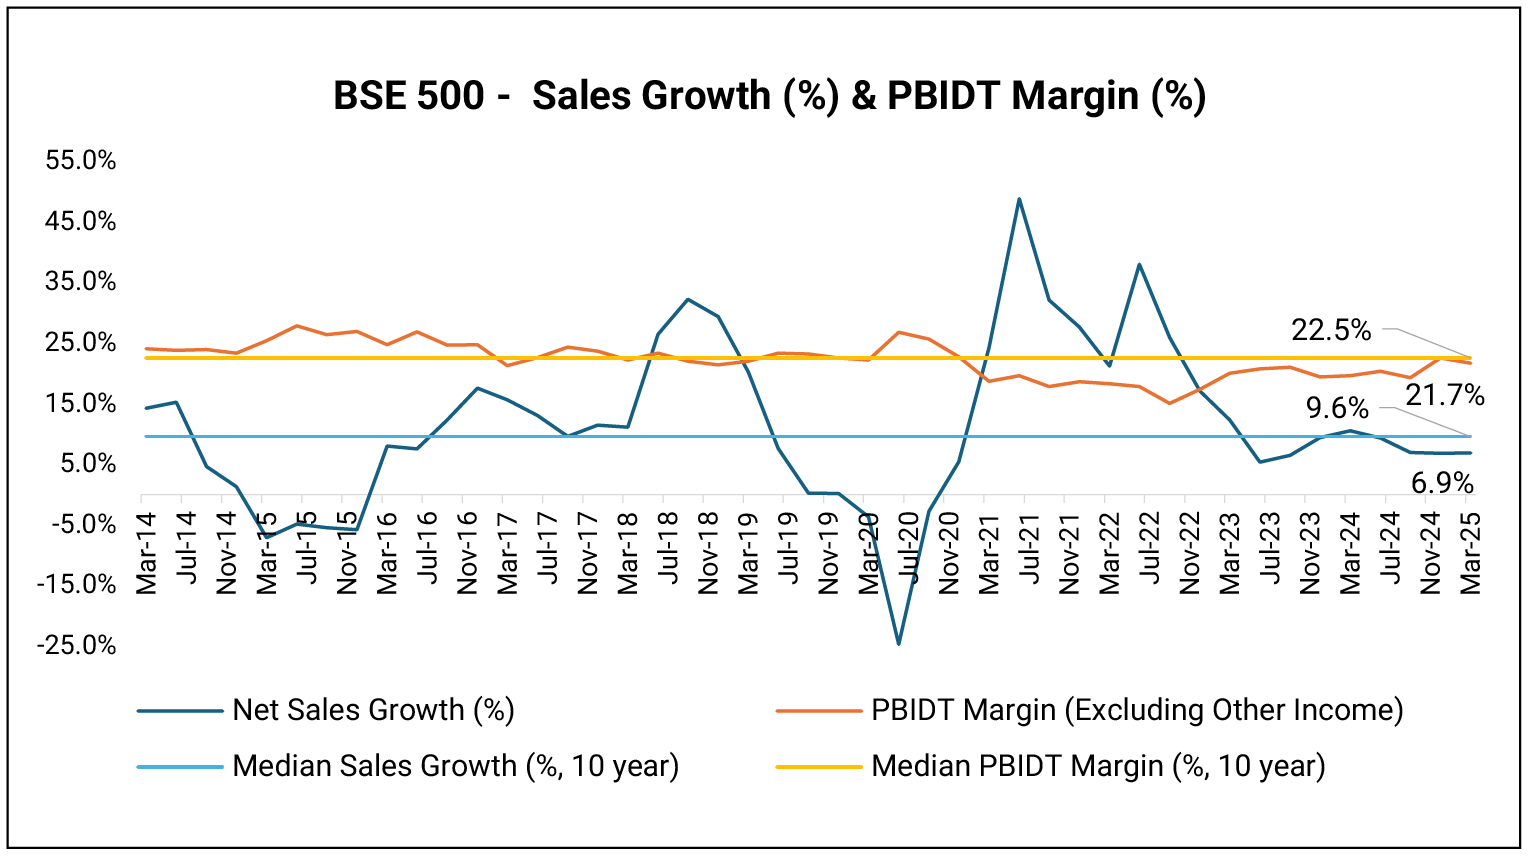
Source: Ace Equity, Quarterly Data as of March-2025; PBIDT: Profit Before Interest Depreciation & Taxes
The flows into equities remained resilient with strong DII (Domestic Institutional Investors) participation. Most of the emerging markets saw an uptick in FPI (Foreign Portfolio Investors) flows after a period of sharp outflows in the past few months and India was no different.
Table 1: Institutional Flows
| In USD Mn | CY2024 | CYTD 2025 | June-25 |
| FPI (Foreign Portfolio Investors) Flows | 124 | -8,877 | 1,690 |
| Mutual Fund Flows | 51,355 | 27,167 | 4,970 |
| Total DII (Domestic Institutional Investors) Flows | 62,470 | 32,211 | 9,563 |
Source: NSDL, SEBI, Data as of June 30, 2025.
As shown in the table below (Refer Table 2), most of the sectors did well during the month. Sectors which are unaffected by global tensions and ongoing consumption slowdown recorded relatively higher performance. Realty index recorded reasonable performance as it could see a demand fillip from the larger than anticipated interest rate cut. FMCG index reported subdued performance as companies are yet to see a visible improvement in demand environment. The rising share of recently launched brands and more avenues to popularize these brands, have impacted the larger established players.
On the global front, US (S&P 500 index) continued its rising trend as geopolitical tensions are expected to have minimal impact. Fed decided to keep the policy rates unchanged as it waits for clarity on inflation front, especially in the wake of ongoing tariff discussions. MSCI Emerging Market Index recorded reasonable performance supported by China, as it established it’s bargaining power on tariffs by limiting availability of essential rare earths.
Table 2: Performance of Major Indices during the Month
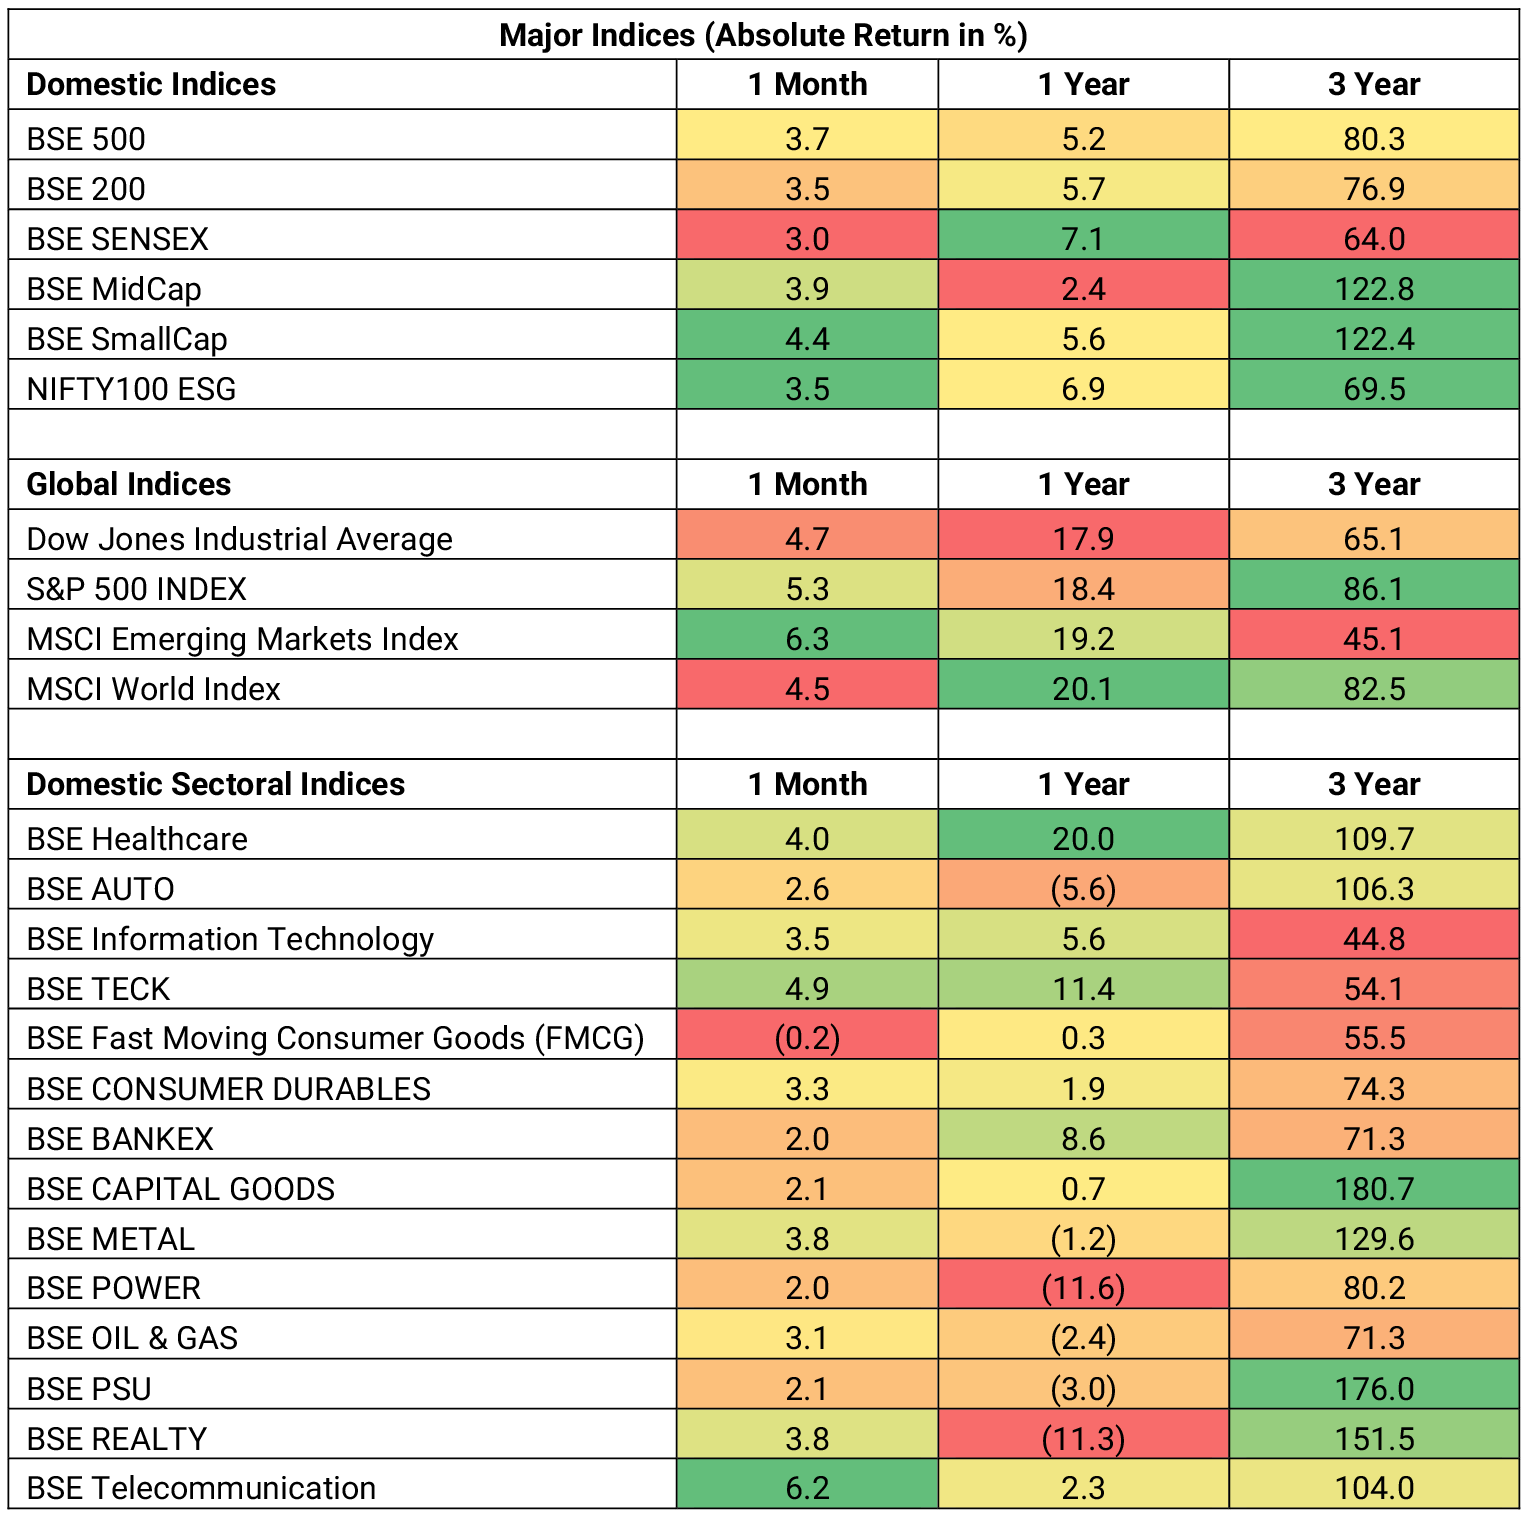
Source: Bloomberg, Data as of June 30, 2025. Past performance may or may not be sustained in the future.
Graph 2: Trend of Corporate Profitability for Listed Universe (% YOY)
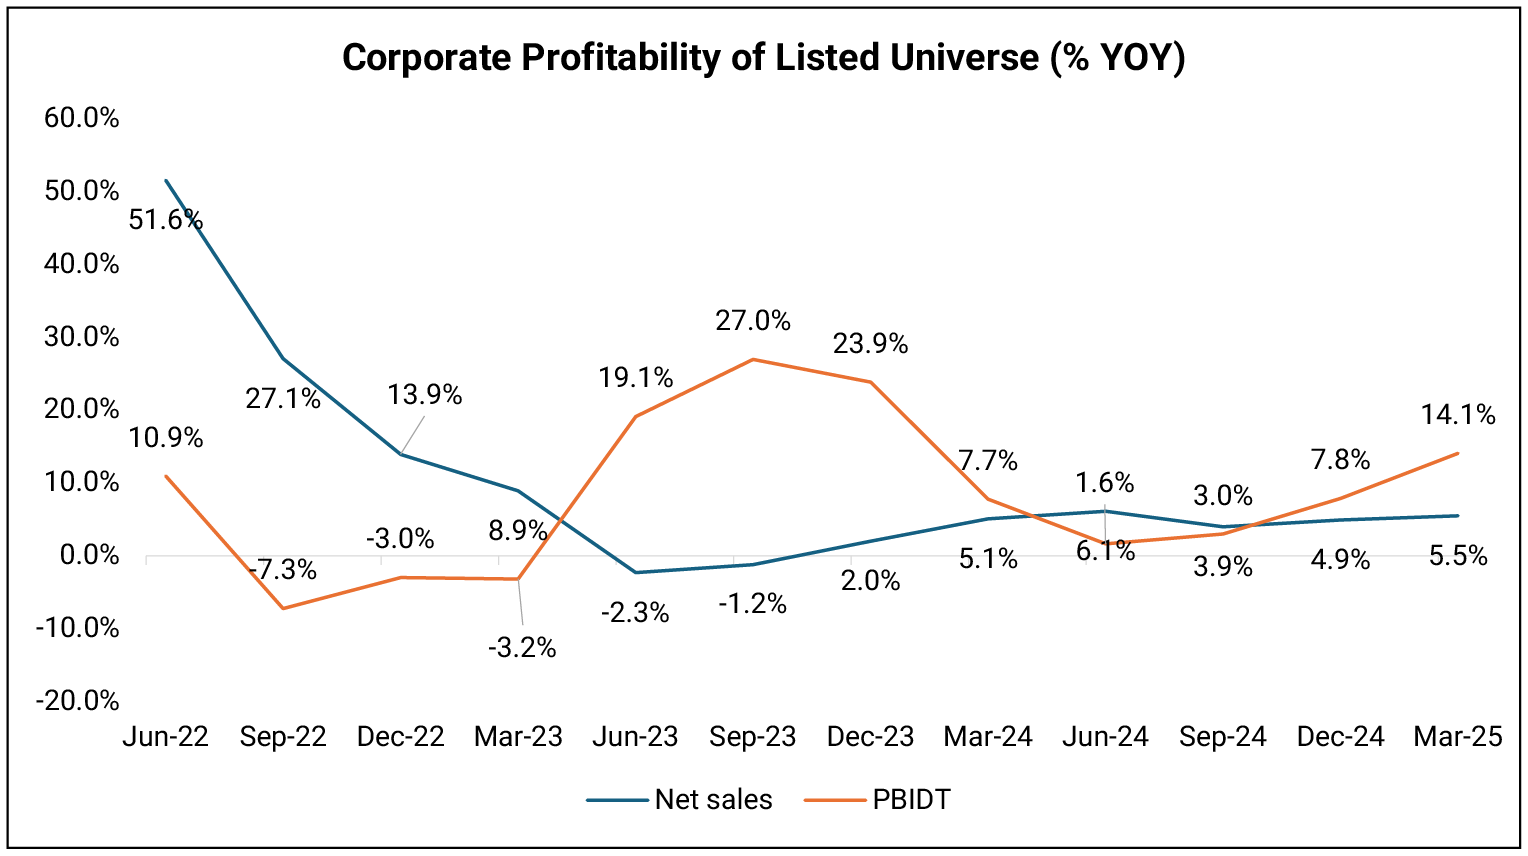
Source: CMIE; Quarterly Data as of March 2025; Net Sales and PBIDT (Profit Before Interest, Depreciation and Taxes) growth is considered.
The following tables (Tables 3 to 8) show the growth indicators of key frontline sectors. Barring few indicators like GST revenue, cement and steel consumption, majority of the indicators don’t suggest a material improvement from the ongoing slowdown. IT Services Annual Contract Value (ACV) remains flat, indicating a subdued hiring environment.
Table 3: Growth in Core Industries and GST Collection
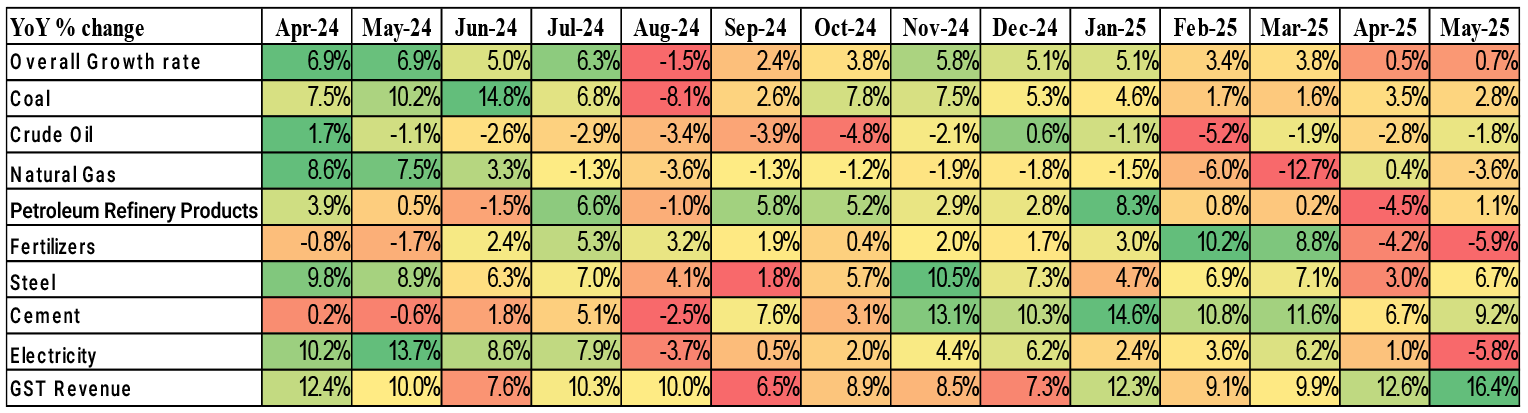
Source: Office of Economic Advisor, Data as of May 2025
Table 4: Credit growth has moderated, and Fresh Term Deposit Rates are coming down
| Mar-22 | Mar-23 | Mar-24 | Jan-25 | Feb-25 | Mar-25 | Apr-25 | May-25 | |
| Deposits Growth YoY % | 8.9% | 9.6% | 13.5% | 12.1% | 12.0% | 10.3% | 9.8% | |
| Bank Credit Growth YoY % | 8.6% | 15.0% | 20.2% | 12.5% | 12.3% | 11.0% | 10.1% | |
| Fresh Term Deposit Rate % | 4.1% | 6.5% | 6.6% | 6.6% | 6.5% | 6.7% | 6.3% | 6.1% |
Source: Reserve Bank of India, Data as of April 2025
Table 5: New Investment Announcements have picked up, though private capex remains flat
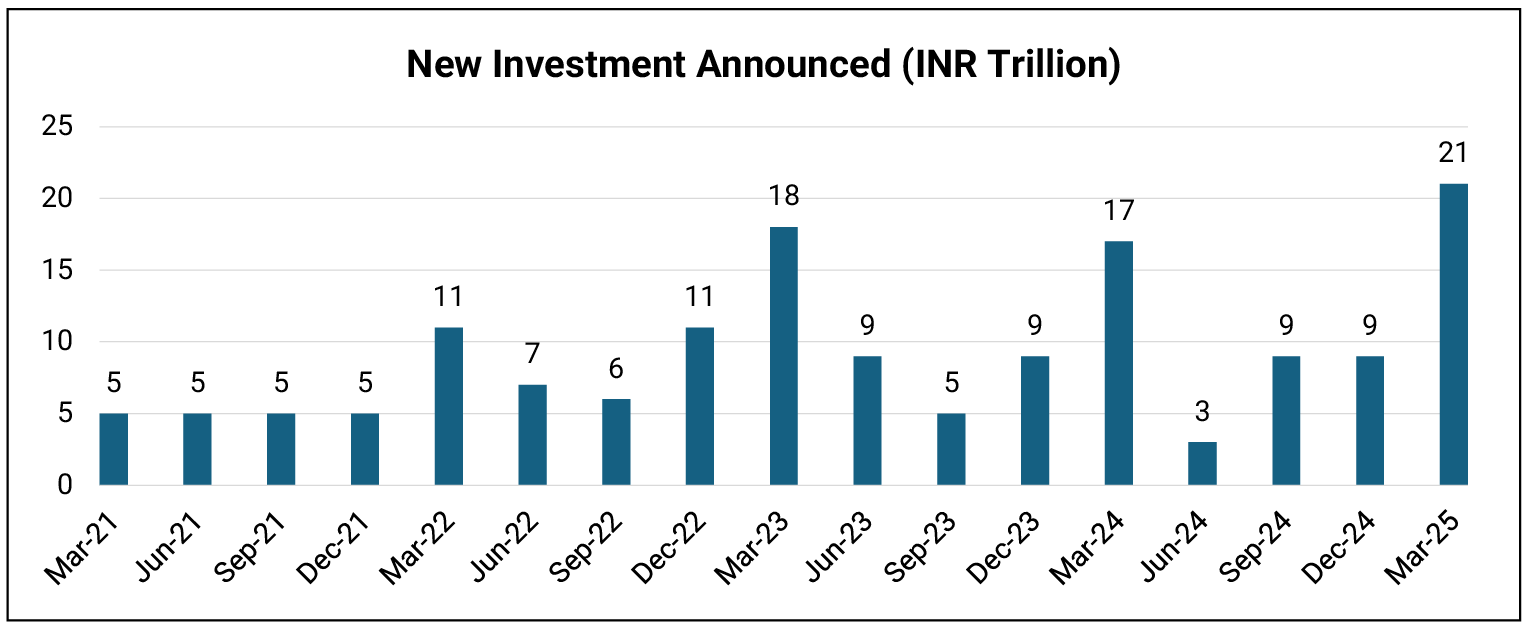
Source: CMIE, Quarterly data as of March 2025
Table 6: Residential Real Estate Sales are moderating on a high base; Home affordability remains attractive
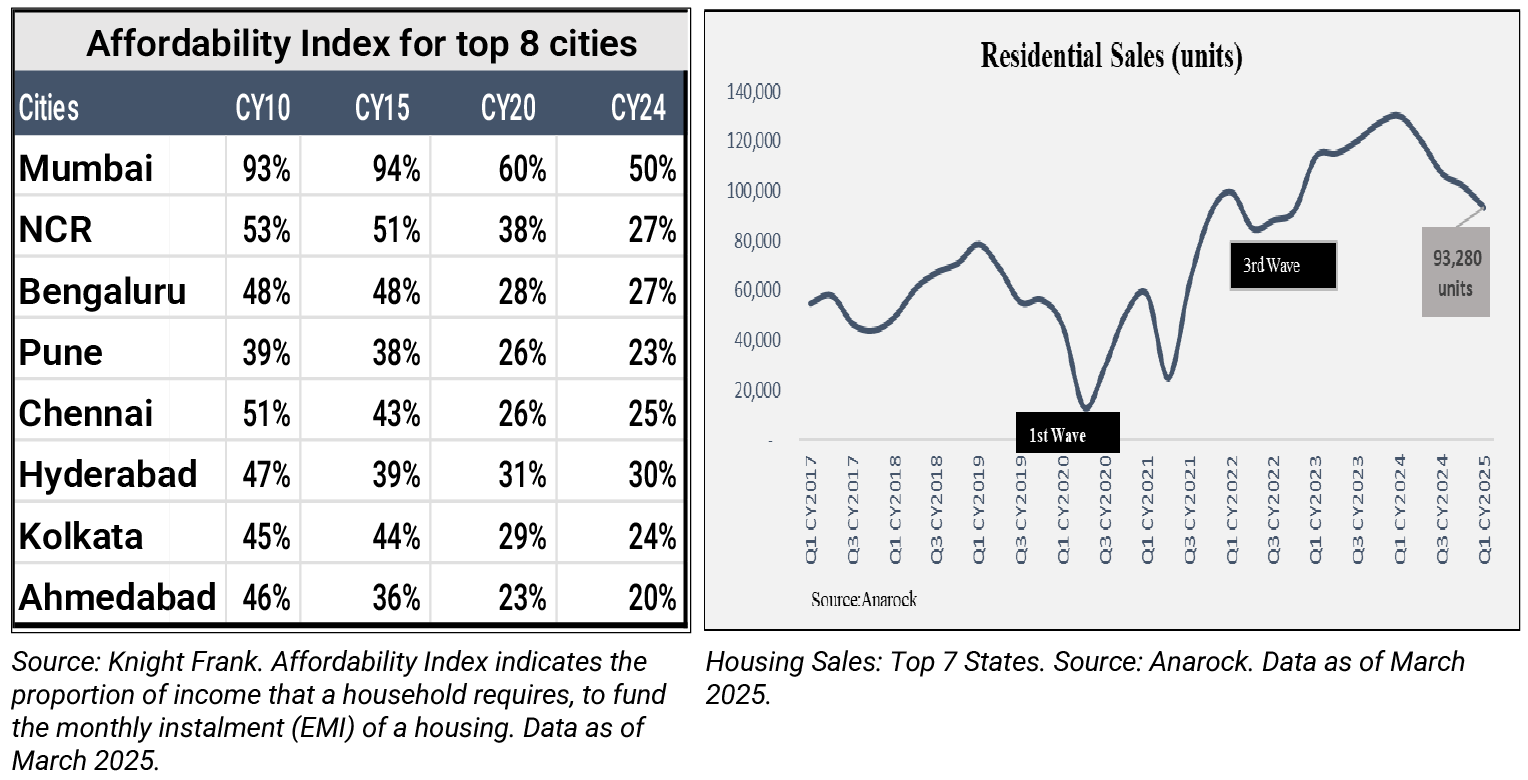
Table 7: Domestic Auto Sales (% YOY)
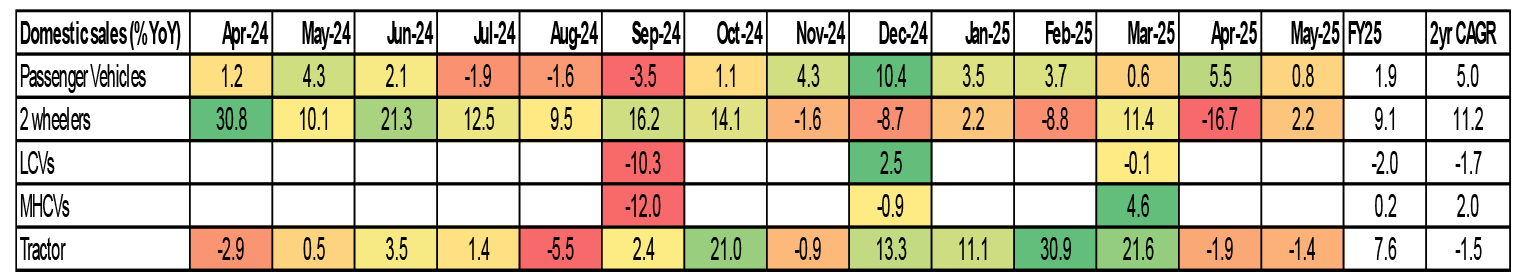
Source: Society of Indian Automobile Manufacturers, Tractor and Mechanization Association; Data as of May 2025; Quarterly data is considered for LCVs (Light Commercial Vehicle) and MHCVs (Medium & Heavy Commercial Vehicle).
While the near-term economic trend is gradually recovering; valuations appear reasonable in pockets within the large cap space (Refer Table 9 and Graph 4). Benign inflation across food and fuel segments could keep inflation contained in the medium term. The ongoing interest rate cuts and potential consumption boost from recent income tax cuts augurs well for the economy over the medium term. While current valuation levels may not offer potential for super normal returns, risk reward appears reasonable in the large cap space. Investors may consider fortifying their large cap allocations to equity in a staggered manner.
Table 8: Deal wins remain flat for IT Services
| (USD Bn) | CY22 | CY23 | CY24 | YoY (%) | 2Y CAGR (%) |
| Managed Services ACV | 27.9 | 30.6 | 30.6 | 0.0% | 4.7% |
| 1QCY23 | 1QCY24 | 1QCY25 | YoY (%) | 2Y CAGR (%) | |
| Managed Services ACV | 7 | 7 | 7.8 | 11.4% | 5.6% |
Source: ISG (Information Services Group). Data as of 1QCY25.
Graph 3: Naukri Jobspeak Index highlights subdued hiring environment in IT Services
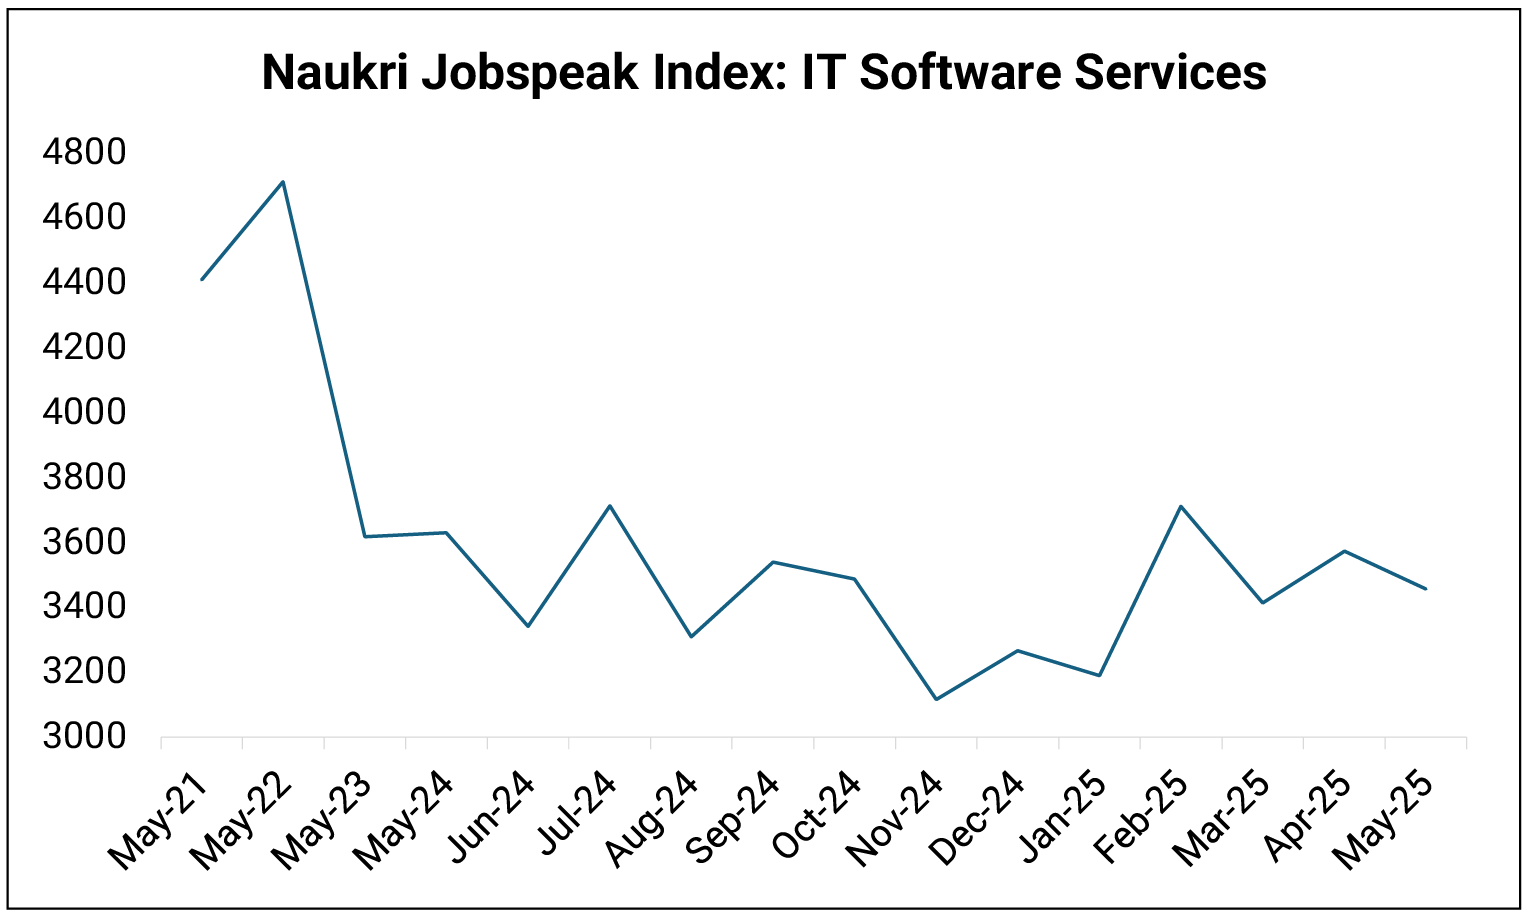
Source: Naukri Jobspeak Index, Data as of May 2025.
While the near-term economic trend is gradually recovering; valuations appear reasonable in pockets within the large cap space (Refer Table 9 and Graph 4). Benign inflation across food and fuel segments could keep inflation contained in the medium term. The recent interest rate cuts, benign inflation, good monsoon and potential consumption boost from income tax cuts augurs well for the economy over the medium term. While current valuation levels may not offer potential for normal returns, risk reward appears reasonable in the large cap space. Investors may consider fortifying their large cap allocations to equity in a staggered manner.
Table 9: Current Valuation Vs Historic Median of major indices

Source: Bloomberg; P/E: Price to Earnings; P/B: Price to Book; Data as of June 30, 2025. Past performance may or may not be sustained in the future.
Graph 4: Long Term Valuation Chart of BSE Sensex Around Historic Average
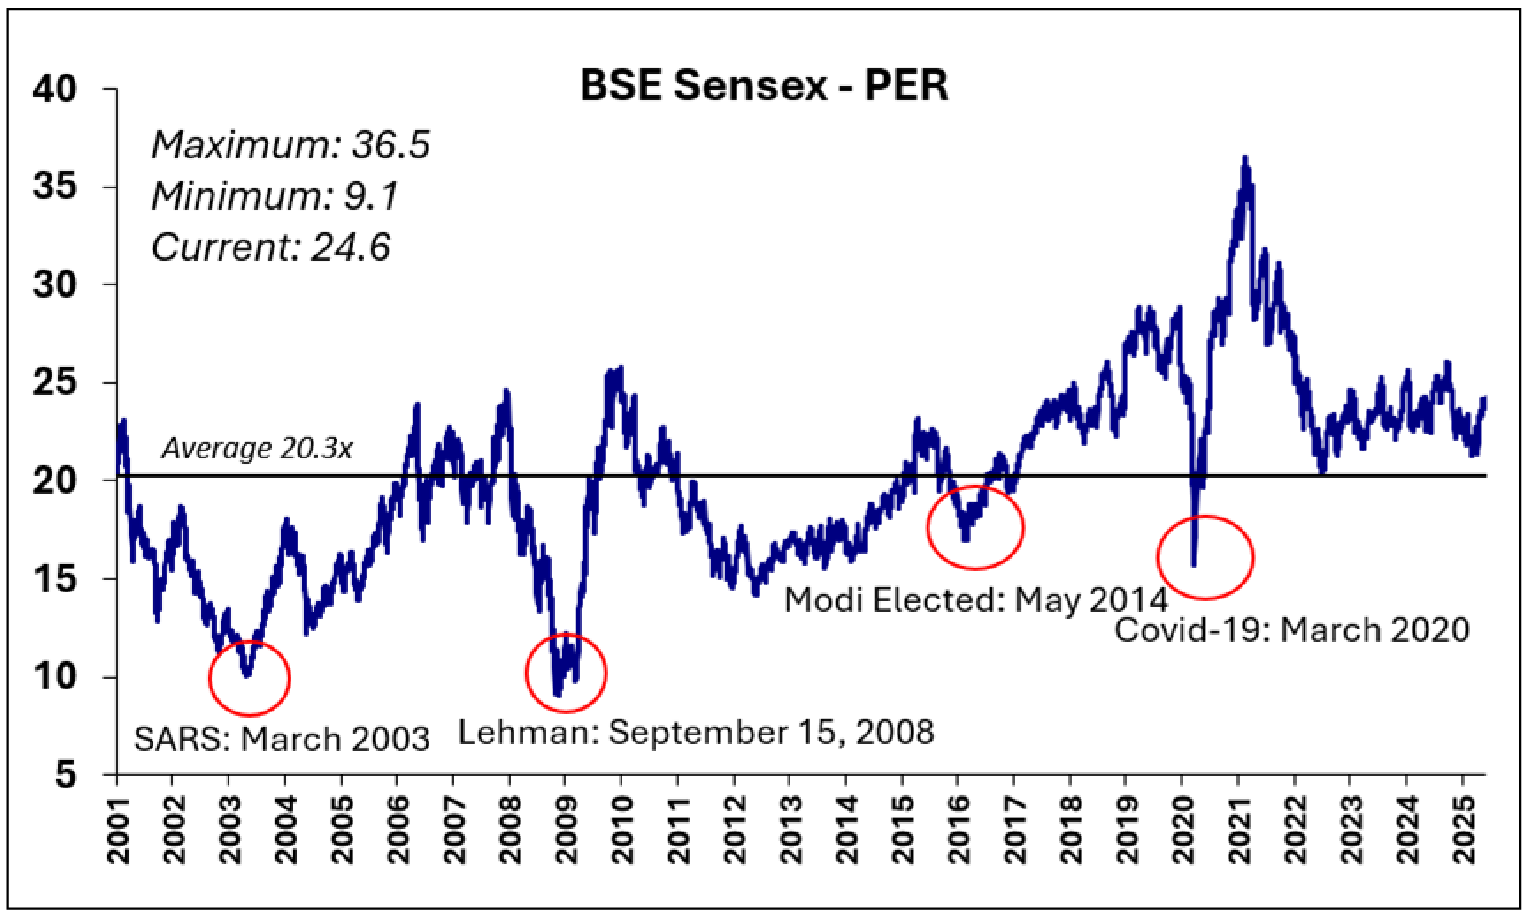
Source: Bloomberg; Data as of June 30, 2025. Past performance may or may not be sustained in the future.
 |
Disclaimer, Statutory Details & Risk Factors:The views expressed here in this article / video are for general information and reading purpose only and do not constitute any guidelines and recommendations on any course of action to be followed by the reader. Quantum AMC / Quantum Mutual Fund is not guaranteeing / offering / communicating any indicative yield on investments made in the scheme(s). The views are not meant to serve as a professional guide / investment advice / intended to be an offer or solicitation for the purchase or sale of any financial product or instrument or mutual fund units for the reader. The article has been prepared on the basis of publicly available information, internally developed data and other sources believed to be reliable. Whilst no action has been solicited based upon the information provided herein, due care has been taken to ensure that the facts are accurate and views given are fair and reasonable as on date. Readers of this article should rely on information/data arising out of their own investigations and advised to seek independent professional advice and arrive at an informed decision before making any investments. Mutual Fund investments are subject to market risks, read all scheme related documents carefully. |
View All
Related Posts
-

Equity Monthly for June 2026
Posted On Monday, Jun 01, 2026
Markets were marginally higher in the month of May. Following table shows the change in broad market cap indices.
Read More -

Equity Monthly for May 2026
Posted On Monday, May 04, 2026
Markets rebounded sharply from the lows of March after announcement of ceasefire. Following table shows the change in broad market cap indices.
Read More -

Equity Monthly for April 2026
Posted On Wednesday, Apr 01, 2026
Markets reacted negatively to the persistent West Asia crisis. Following table shows the change in broad market cap indices.
Read More

