Portfolio Insurance works! and works very well !
Posted On Monday, Nov 10, 2008
The month of October has been tumultuous for the stock markets. The benchmark BSE SENSEX was down by 24% in October, taking its year to date fall to 52%. Some of the midcap stocks have witnessed a year to date market value erosion of almost 75%.
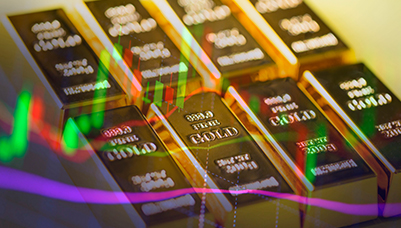
We offered investors a portfolio insurance in February 2008 by way of a new fund offer in the form of Quantum Gold Fund ( QGF ). The fund was launched with the Quantum philosophy viz "Low Cost and Direct to Investors model". It was a simple, low cost and hassle free way to take exposure to Gold
Quantum Gold Fund was launched with the belief that Gold works as a "Portfolio Insurance" - very similar to life or car insurance. It cushions or limits your losses from other asset classes in your portfolio such as stocks. You may or may not avail the benefits of an insurance policy every year; nevertheless the premiums are paid annually to keep the policy on, so that you are protected from losses that may occur any time, without notice.
Investors who had applied for QGF in the NFO in February 2008, may not have gained since the gold prices are a little lower now, but not as low as the SENSEX. Those who had allocated some money to QGF, would have been able to limit their losses from the stock markets which fell by nearly 44% since the QGF NFO. The table below gives an example on how Gold worked as a portfolio insurance under various asset allocation scenarios.
| Scenario 1 | Scenario 2 | Scenario 2 | ||||
| Allocation | Returns | Allocation | Returns | Allocation | Returns | |
| SENSEX | 100% | -43.6% | 90% | -43.6% | 80% | -43.6% |
| Quantum Gold Fund | 0% | -2.7% | 10% | -2.7% | 20% | -2.7% |
| Portfolio Returns | -43.6% | -39.5% | -35.4% | |||
| Savings due to QGF | 0% | 4.1% | 8.2% | |||
| Domestic Price of Gold | - 5.0% | - 5.0% | - 5.0% | |||
Notes: QGF - Returns for QGF NFO investors from the allotment price (Rs 592.8748) to 31st October 2008.
(Allotment date was 22nd Feb 2008)
SENSEX Returns are from 22nd Feb 2008 to 31st October 2008.
Past performance may or may not be sustained in the future.
It has also been historically true. When the stock markets suffered, gold could have limited your overall losses as seen in the table below.
| Year | Sensex | Gold INR |
| 1982 | 4% | 21% |
| 1986 | -1% | 29% |
| 1987 | -16% | 22% |
| 1995 | -21% | 13% |
| 1998 | -16% | 8% |
| 2000 | -21% | 1% |
| 2001 | -18% | 6% |
| 2002 | 4% | 24% |
| 2008* | -52% | 9% |
* As on 31st October 2008

View All
Related Posts
-

Equity Outlook - July 2026
Posted On Wednesday, Jul 01, 2026
Indian equities recovered in the month of June, as the West Asia crisis showed signs of de-escalation.
Read More -

Debt Outlook - July 2026
Posted On Wednesday, Jul 01, 2026
The Indian fixed income market enters the second half of FY27 with a macro backdrop that is becoming increasingly supportive for bonds, even as inflation risks remain on the horizon.
Read More -
Gold Outlook - July 2026
Posted On Wednesday, Jul 01, 2026
June closed out with gold breaching the $4,000/oz1 mark for the first time since November 2025. The move capped a reversal that built steadily through June, standing in sharp contrast to May's far quieter tone.
Read More

