Equity Monthly for August 2025
Posted On Friday, Aug 08, 2025

The markets took a breather in the month of July after four successive months of positive returns with Sensex declining by 3.0%. The BSE mid and small cap indices declined by 3.9% and 4.4% respectively. Some of the key developments during the month were:
- US Tariff deals with host of countries like UK, Japan, Vietnam etc. Proposed tariff on Indian exported goods is at 25%.
- Inflation is clearly moderating, and inflation print for the month of June 2025 stands at 2.1%.
- Current earning season points to further earnings cut to FY26/27.
- Globally Fed continued to be in the “wait and watch” mode, wary of potential inflation pressure due to tariffs.
Table 1: Performance of Major Indices during the Month
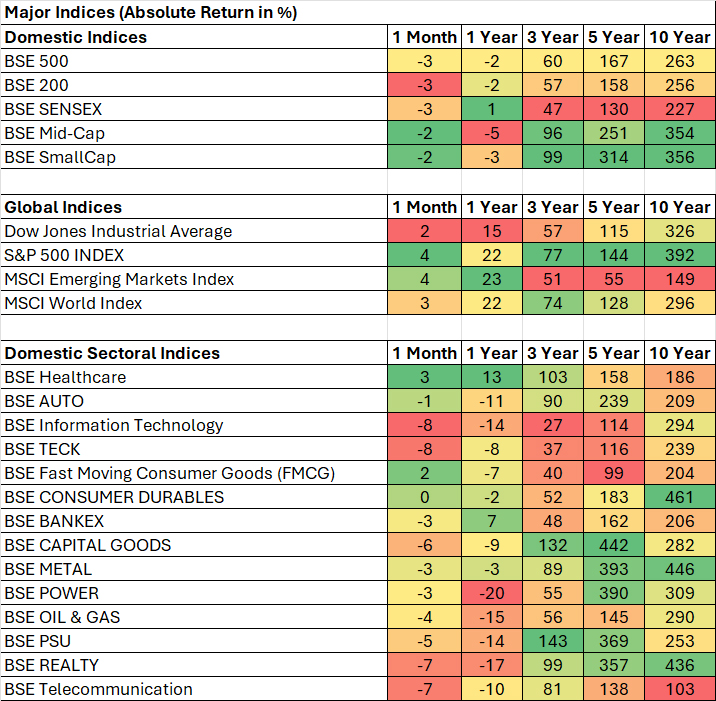
Source: Bloomberg, Data as of 31 July, 2025
Past performance may or may not be sustained in the future.
As shown in the table (Refer Table 1), except Healthcare and FMCG most of the sectors fell in line or more than the index. The performance is reflective of the earning season underway. Of the companies who have reported, earnings continued to be weak in Technology and financial space.
On the global front, the US (S&P 500 index) continued its rising trend; in the latest policy meet Fed decided to keep the policy rates unchanged adopting a “wait and watch approach” on the wake of ongoing tariff discussions. MSCI Emerging Market Index recorded reasonable performance supported by China.
DII Flows have remained resilient:
The flows into equities remained resilient with strong DII (Domestic Institutional Investors) participation. July also witnessed certain large IPOs, which absorbed the flow into markets. FPI flows turned negative after four months positive inflows, driven by valuation constraints in India and tariff uncertainty.
Table 2: Institutional Flows
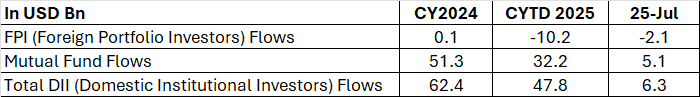
Source: NSDL, SEBI, Data as of 31 July, 2025
Tariff Impact on India:
- President Trump proposed 25% tariff on India w.e.f. 1 August 2025. In addition to the tariffs, certain penalties are also proposed to be levied on India, because of Energy and defense ties with Russia. On the economic front, goods trade with US is limited to 18% of goods exports; and a potential 25% tariff on USD 87bn (goods trade with US) that will not make a large dent on the economy.
- But the proposed tariff is clearly on the higher side compared to expectation. Some of the competing countries have got better tariff rates compared to India. More importantly Russia fulfills 30%+ crude requirement for India; thus, to change the import mix, will come at higher energy cost.
Table 3: Export composition to USA
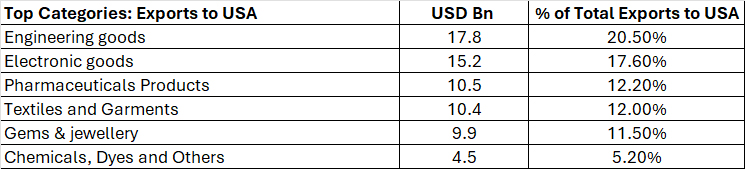
Source: CMIE, Data as of 31 March 2025
Assuming these tariff stays, the impacted sectors are:
- Auto/Auto-Ancillary: Large Indian OEM have very limited exposure to US; hence the impact is insignificant. Auto ancillaries will be impacted as a large proportion of exports are catering to the US. The US exposure ranges from 5-40% sales to US. In our view, the ability to pass on the cost increase is limited and margins can be impacted.
- Pharmaceuticals: Under the earlier tariff order Pharmaceuticals were exempted as a category. Whether these exemptions apply remains to be seen. Bulk of the generic volumes in US comes from India with minimal alternatives available. In our view if generics pharma is taxed at 25%, there is a high likelihood that Indian companies will be able to pass some of the cost increases to end consumers.
- Textile: Higher tariffs will impact on the textile sector; as the US accounts for majority of textile exports by the listed players. In addition, competing countries are operating at lower tariffs, making them competitive. Indian players will face pressure on margin as big box retailers negotiate for lower prices.
- Chemical: Indian chemical companies have reasonable exposure (+5-20% of revenues) to US. The impact will be more product specific; i.e depending on the complexity of manufacturing and nuances around tariff imposed on competing geographies.
- Energy: Some of the refiners and OMC (Oil Marketing Companies) have benefited from cheap Russian oil supply in the past. Given the penalties proposed by US, there can be implications on the potential margins.
- Other sectors such as EMS (Electronics Manufacturing Services), Metals and Solar and Tiles, will see limited impact due to higher tariffs, given the US exposure (apart from Solar, the exports to US are less than 10% of revenues for these sectors).
Earning season points further earnings cut
Graph 1: Trend of Corporate Profitability for Larger Listed Universe (% YOY)
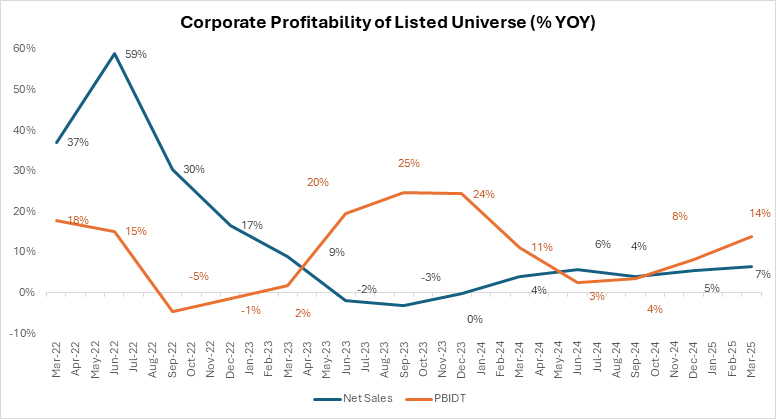
Source: CMIE; Quarterly Data as of 31 July 2025 ; Net Sales and PBIDT (Profit Before Interest, Depreciation and Taxes) growth is considered.
Graph 2: Aggregate Sales Growth & PBIDT Margin of BSE 500 Index
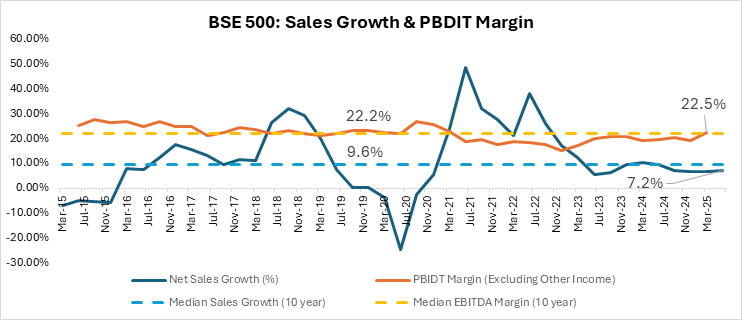
Source: Ace Equity, Data as of July-2025 ; PBIDT: Profit Before Interest Depreciation & Taxes.1q26 has 225 companies; who have reported in 31 July 2025.
Table 4: Consensus Earnings for FY26 has come down.
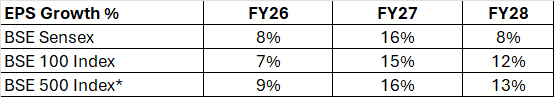
Source: Bloomberg; Data as of July 31, 2025. *BSE 500 has limited analyst coverage due to the larger universe.
Banks/NBFC:
- For the banking sector <60% of loan books are external benchmark linked. Given the interest cuts by the central bank, the lending yield has declined by ~44bps YoY for the scheduled commercial banks, as of June end. The repricing of liability will take time. Given this mismatch, most banks have reported a decline in margins. In some pockets credit costs have also moved higher.
- Given these challenges barring a few large banks, operating profits growth has been muted. We remain largely positive on the banks. Credit should improve at system level from current ~8-9% to 12-13% and some of the well-run banks can grow much faster than system growth. Even after assuming normalized credit cost and margins pressures, we believe banks look attractive at current valuation.
Table 5: Credit growth has moderated, and Fresh Term Deposit Rates are coming down
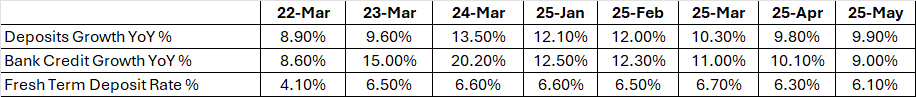
Source: Reserve Bank of India, Data as of 31 July 2025
Auto:
- PV(Passenger Vehicle) and 2-Wheeler segments are going through an inventory correction because of which the volume growth is tepid. The tractor sector has done well on the back of good harvest season. CV(Commercial Vehicle) remains weak, indicating subdued economic trends. Most of the reported results were in line with these broader trends.
Table 6: Domestic Auto Sales (% YOY)
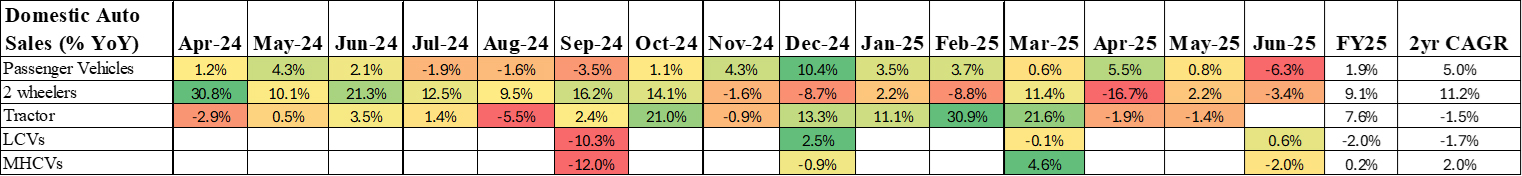
Source: Society of Indian Automobile Manufacturers, Tractor and Mechanization Association; Data as of July 2025 ; Quarterly data is considered for LCVs(Light Commercial Vehicle) and MHCVs(Medium & Heavy Commercial Vehicles).
IT Services:
Table 7: Deal wins remain Subdued
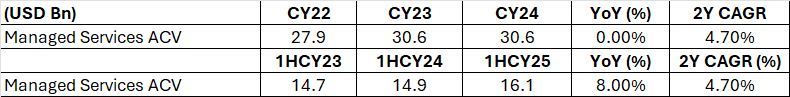
Source: ISG (Information Services Group). Data as of 31 July 2025.
- Most IT Services majors reported weak demand trends owing to macro uncertainty in US. The deal wins and growth are reflective of the same. Margins were also subdued due to lower growth.
- Median Constant currency Revenue growth over the past 2 years for large IT services players is ~2.5% CAGR. IT services can be cyclical and clearly the current global backdrop has delayed the recovery. In our view, fundamental drivers of IT sourcing still hold be it onsite offshore cost arbitrage; efficiency play and delivering at scale. All these propositions remain relevant. Given these positives, we expect a recovery in growth for these companies.
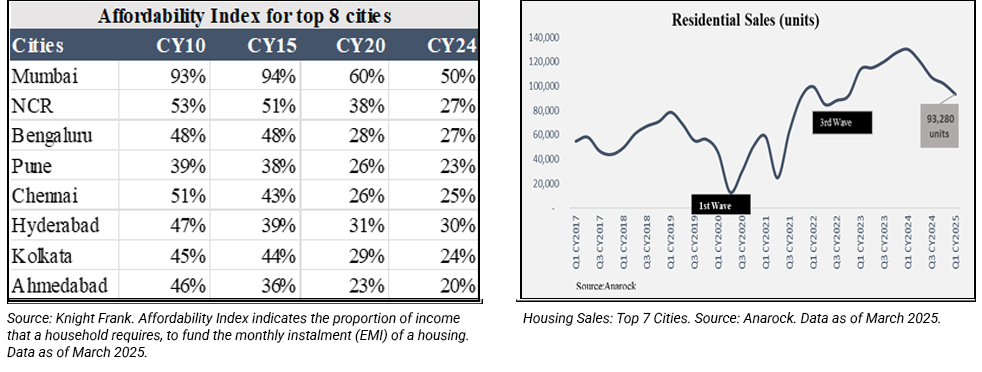
While economic backdrop is favorable; high frequency indicators do not suggest pickup in Growth
Majority of high frequency indicators don’t suggest a material improvement from the ongoing slowdown. Near-term growth could be driven by higher rural consumption and government capex spends. Moonsoon progress remains above normal and is predicted to be good for the rest of the season. Combination of this with higher MSP (Minimum Support Price) being offered by government; should help sustain Rural recovery. The lower interest rate regime is conducive for private sector capex; but uncertainty around tariff may keep the corporates on the fences.
Table 8: Growth in Core Industries and GST Collection
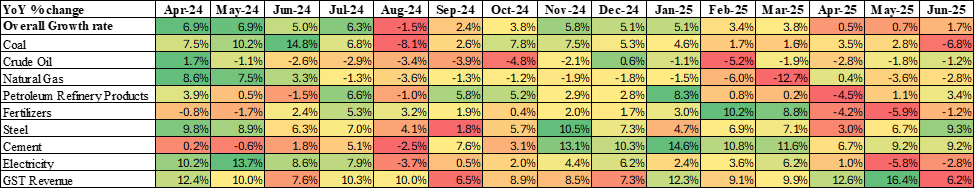
Source: Office of Economic Advisor, Data as of 31 July 2025
Table 9: New Investments Announcements have declined; Government spending has improved
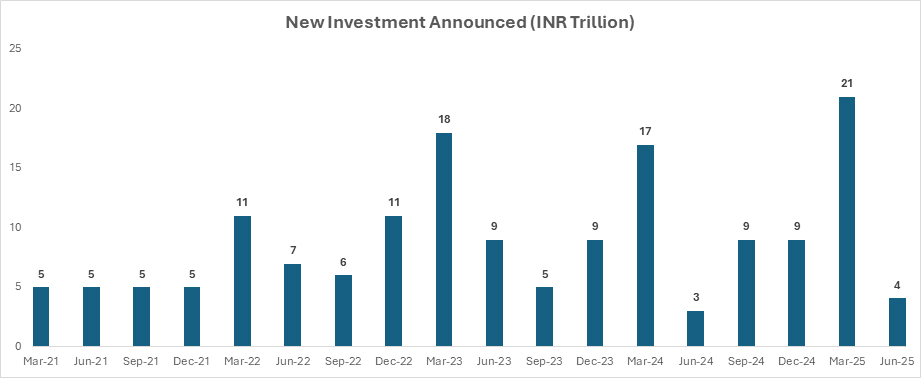
Source: CMIE, Data as on31 July 2025
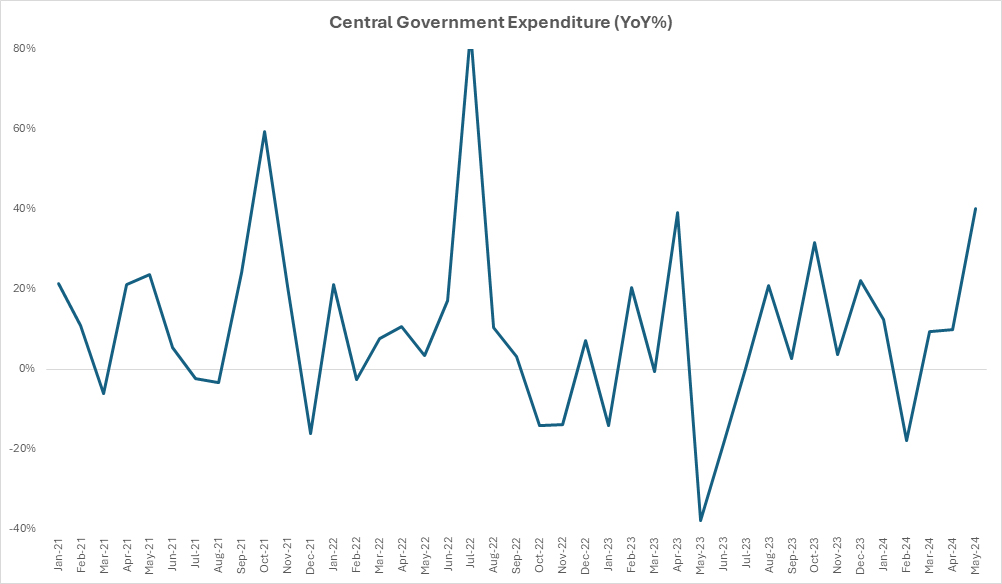
Source: CMIE, Data as of 31 July 2025
Graph 3: Naukri Jobspeak Index highlights subdued hiring environment in IT Services
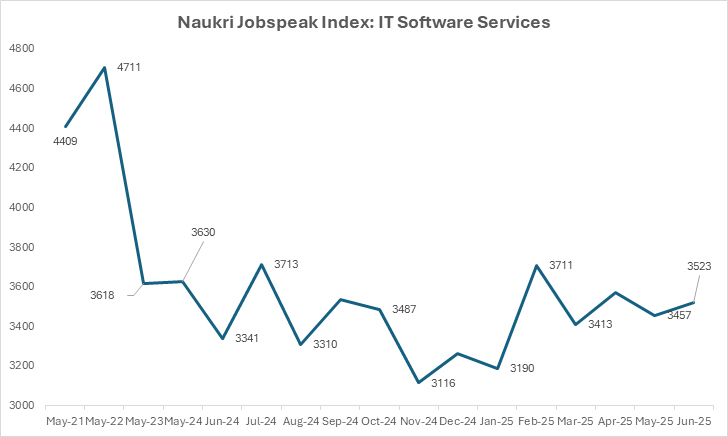
Source: Naukri Jobspeak Index, Data as of 31 July 2025.
While the near-term economic trend is gradually recovering; valuations appear reasonable in pockets within the large cap space (Refer Table 9 and Graph 4). Benign inflation across food and fuel segments could keep inflation contained in the medium term. The recent interest rate cuts, benign inflation, good monsoon and potential consumption boost from income tax cuts augurs well for the economy over the medium term. While current valuation levels may not offer potential for super normal returns, risk reward appears reasonable for a long-term investor.
Table 11: Current Vs Historic Valuations of major indices
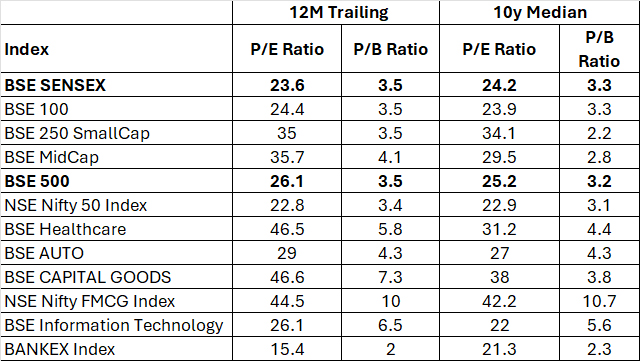
Source: Bloomberg; P/E: Price to Earnings; P/B: Price to Book; Data as of 31 July, 2025
Past performance may or may not be sustained in the future.
Graph 4: Long Term Valuation Chart of BSE Sensex Around Historic Average
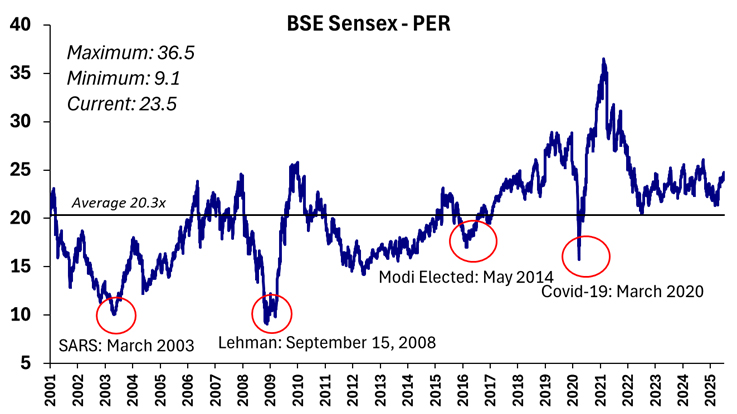
Source: Bloomberg; Data as of 31 July, 2025
Past performance may or may not be sustained in the future.
 |
Disclaimer, Statutory Details & Risk Factors:The views expressed here in this article / video are for general information and reading purpose only and do not constitute any guidelines and recommendations on any course of action to be followed by the reader. Quantum AMC / Quantum Mutual Fund is not guaranteeing / offering / communicating any indicative yield on investments made in the scheme(s). The views are not meant to serve as a professional guide / investment advice / intended to be an offer or solicitation for the purchase or sale of any financial product or instrument or mutual fund units for the reader. The article has been prepared on the basis of publicly available information, internally developed data and other sources believed to be reliable. Whilst no action has been solicited based upon the information provided herein, due care has been taken to ensure that the facts are accurate and views given are fair and reasonable as on date. Readers of this article should rely on information/data arising out of their own investigations and advised to seek independent professional advice and arrive at an informed decision before making any investments. Mutual Fund investments are subject to market risks, read all scheme related documents carefully. |
View All
Related Posts
-

Equity Monthly for May 2026
Posted On Monday, May 04, 2026
Markets rebounded sharply from the lows of March after announcement of ceasefire. Following table shows the change in broad market cap indices.
Read More -

Equity Monthly for April 2026
Posted On Wednesday, Apr 01, 2026
Markets reacted negatively to the persistent West Asia crisis. Following table shows the change in broad market cap indices.
Read More -

Equity Monthly for March 2026
Posted On Monday, Mar 02, 2026
Markets were range bound with a marginal decline in Sensex. BSE mid and small cap indices
Read More

