Debt Monthly for August 2025
Posted On Friday, Aug 08, 2025

Key highlights of the month: |
|
Chart I: Tracking India’s 10-Year Bond Yields Against Major Global Economies
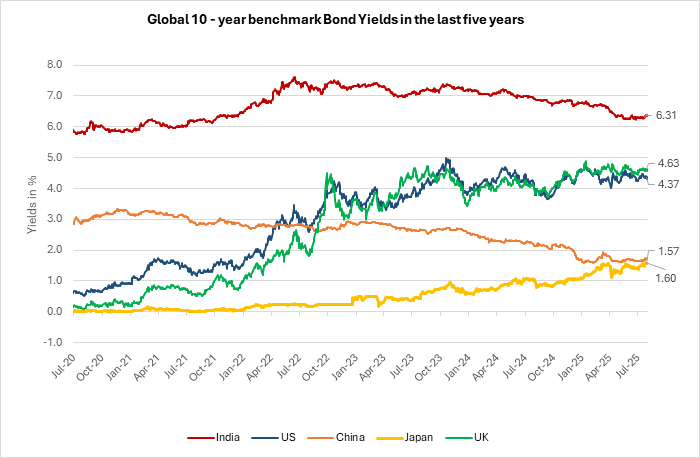
Source: Bloomberg. Quantum AMC Graphics. Data up to July 31, 2025
The big headline for the debt market in July came on the second-last day of the month when the US announced a 25% tariff on Indian exports to the US, effective 1st August 2025, along with unspecified additional penalties targeting oil trade and defense purchases from Russia.
The US cites non-monetary trade barriers and concerns over India’s energy and weapons ties with Russia. Despite several rounds of negotiations, key sticking points (particularly around agriculture and dairy imports) remain unresolved. The Indian government has responded firmly, stressing its commitment to protecting farmers, entrepreneurs, and MSMEs, and promised to take all necessary measures to safeguard national interests.
On the Russia trade front, the situation is further complicated by India’s significant imports, including ~650 million barrels of oil annually, which provides India ~$4 billion in savings. Plus, ~36% of India's defense equipment comes from Russia. With the US penalties looming, India now faces a tightrope walk, needing to balance its US trade relations while not alienating Russia.
Chart II: US Trade Snapshot: Leading Countries by Imports, Exports & Balance
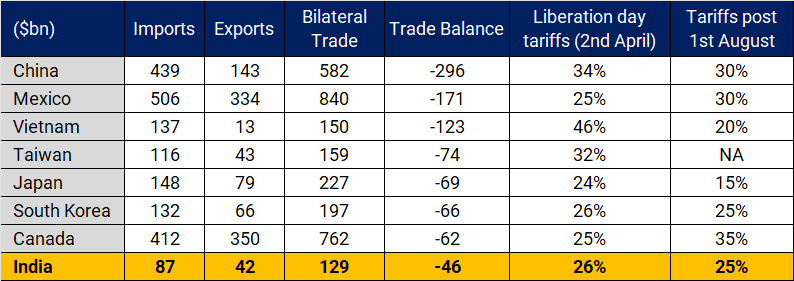
Source: US Trade. Quantum AMC Graphics. Data up to FY 2024.
India’s Trade Ties with the US: India clocked a solid goods trade surplus of $46 billion with the US in 2024 (about 1.2% of GDP) with America standing tall as India’s top export destination, accounting for 18% of total outbound shipments.
A standout highlight? India did overtake China in smartphone production and had ~ 44% of US imports in this category (Q2 FY 2024), ahead of Vietnam (30%) and China (25%). That’s a serious shift in global manufacturing dynamics.
However, recent tariff announcements have stirred the pot. With Vietnam’s tariffs set at 20% (lower than India’s) there’s a chance some manufacturing could pivot away from India. That said, it’s early days, and a lot hinges on ongoing trade negotiations. For instance, sectors like pharmaceuticals could see rising costs for the US consumer, potentially forcing a rethink. It’s also unclear whether pharma will be exempted from these new tariffs.
One thing we believe is certain: We’re heading toward a global supply chain reset.
Our analysis shows that if exports to the US dip by 10%, it could shave 0.2% off our GDP. A 20% drop escalates to a 0.4% hit. This comes at a time when global growth is already looking soft, and any slowdown in India’s exports could trigger ripple effects, including reduced capital flows.
That said, we’re holding our ground on India’s growth forecast of 6.3% for FY 26. We don’t see this tariff move immediately influencing the RBI’s policy stance or the monetary policy action. We still expect a pause in the August 2025 RBI policy meet.
Trade and Currency Trends: What to Watch
Trade volumes on both the export and import sides are likely to soften ahead, largely due to the ripple effects of tariffs. Since a good share of imports are used as inputs for exports (due to integrated global value chains) tariff impacts may be felt across the board.
We estimate the Current Account Deficit (CAD) at around 0.7% of GDP, though there's a possibility this figure could move higher going forward.
On the currency front, the Indian Rupee (INR) has weakened by 2.4% since the start of the calendar year. Still, from a Real Effective Exchange Rate (REER) perspective, it remains competitively positioned near the 100 mark. This comes despite the U.S. Dollar Index declining by 8% over the same period.
More recently, the Dollar Index has reversed course and started strengthening again, spurred by new trade agreements. In response, many global currencies, including the INR, have shown a depreciation trend. The rupee has been among the weakest performers in the emerging market currency basket this July, slipping by 1.9% so far, and may remain under pressure in the near term.
Chart III: INR Faces Continued Headwinds Amid Global Volatility
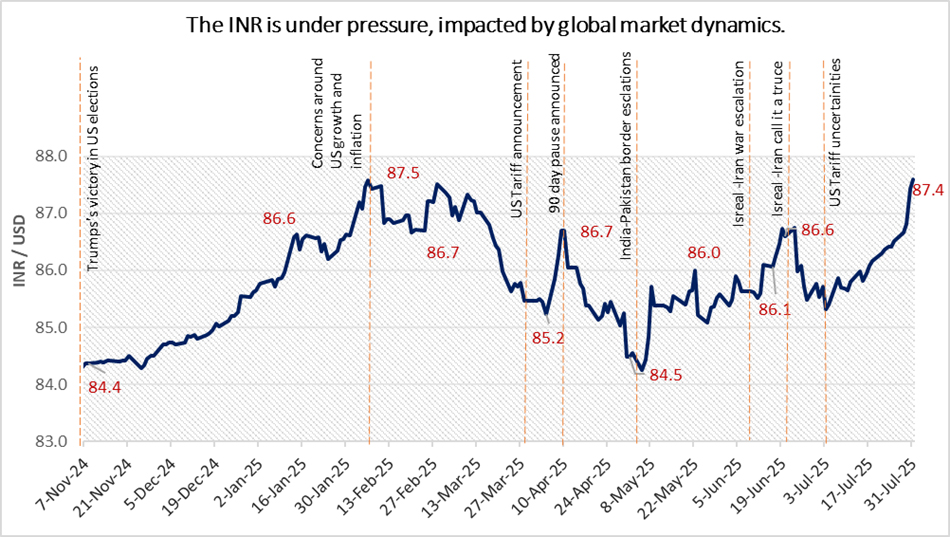
Source: Bloomberg. Quantum AMC Graphics. The above data is for the period starting the victory of Donald Trump in the US Presidential elections (06th November 2024) till 31st July 2025
Headline CPI Eases, But Core Keeps the Pressure On:
CPI inflation slowed down to 2.1% in June, easing from 2.8% in May, in line with our estimates. This June reading marks the lowest inflation print in nearly six and a half years. The main driver behind this continued cool-off? Food and beverages. Inflation in this category actually dipped 0.2% year-on-year in June, after climbing 1.5% in May. The decline has been pretty broad-based, with vegetables, pulses, spices, and meat all seeing year-on-year price drops. Cereals inflation also continues to inch down, adding to the softening trend.
On the flip side, core inflation (which strips out food and fuel) edged up slightly to 4.5% in June, from 4.3% in May. The bump came mainly from higher goods prices, while services inflation held steady. This uptick is mostly due to a less favorable base effect and a rise in gold prices.
Chart IV: CPI at Six-Year Low: Food-Led Cooling Masks Sticky Core Pressures
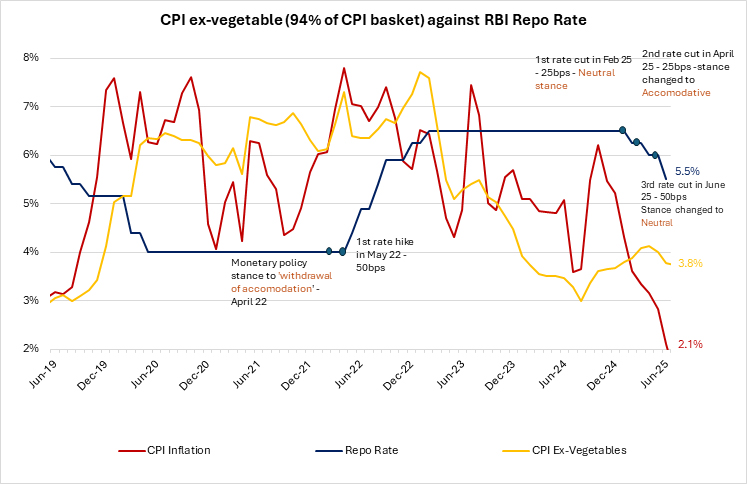
Source: MOSPI, RBI. Quantum AMC Graphics. CPI data is for the month of June 2025, Repo Rates are as of June 30, 2025
Looking deeper, core-core inflation (which excludes gold, silver, and fuels) remained muted at 3.6% in June, compared to 3.5% in May. Within this, personal care (again, gold-driven) and education costs rose, while clothing and footwear moderated. Over a six-month period, core-core CPI inflation averages just 3.5%.
Looking ahead, our July CPI inflation estimate is tracking near 1.2%, helped by further softening in food prices and a supportive base. In the first half of July, vegetable and pulses prices have continued to fall at a faster pace year-on-year. Cereals inflation remains on a downward path, though edible oils are still trending higher despite the cut in customs duty. Core inflation, however, is expected to be in the ~ 4.3% YoY range for July, largely influenced again by a tough base and elevated gold prices. Our FY 26 CPI estimate is ~2.8%.
Indian Bond Yields Climb amid global market developments:
On the domestic front, Indian bond yields experienced an upward movement. While the shorter-end of the curve remained relatively stable, bolstered by strong demand, the longer-tenor bonds faced greater pressure. By the end of the month, however, yields had largely reverted to the levels seen at the start of the period.
The rise in domestic yields was further fueled by comments from the RBI Governor, who highlighted that the future inflation outlook (rather than current trends) would be the key driver for shaping monetary policy decisions. Despite the upward shift in yields, steady demand at the Government Security (G-sec) auction acted as a cushion, preventing a more significant increase.
Chart V: G-sec yield curve remains steep, but the yield curve has shifted upward with yields rising amid global market developments.
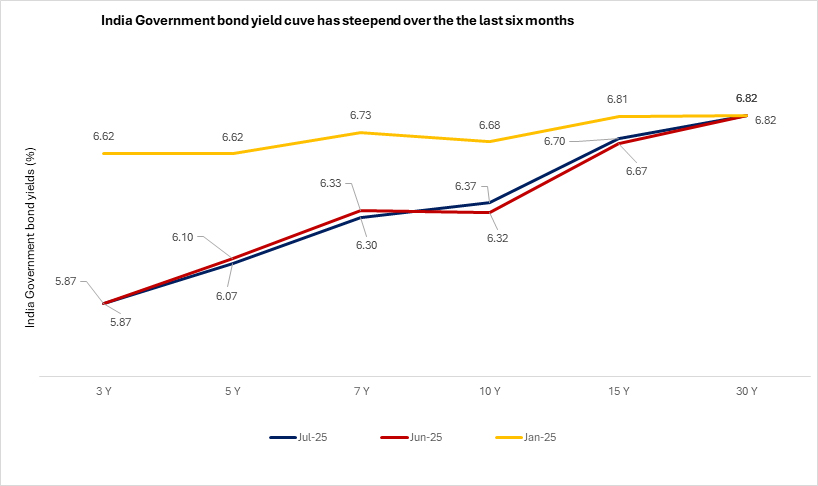
Source: Bloomberg. Quantum AMC Graphics. Above data is for the month ended July 2025, June 2025 (1 month ago) and January 2025 (6 montsh ago).
Money market yields in India remained rangebound on the back of liquidity support by the RBI. The RBI stepped in with measures to manage excess liquidity in the system, holding VRR and VRRR auctions. T-bill rates the remained more or less steady compared to June 2025. Meanwhile, the 3-month AAA PSU CP/CD rates too moved up due to higher supply to the 5.95%- 6.1% range against the 5.80% - 6.10% band on a closing basis.
Chart VI: Money Market Rates remained rangebound on the back of liquidity measures by the RBI; Corporate bond yields inched up across the curve broadly tracing the up move in G-sec yields
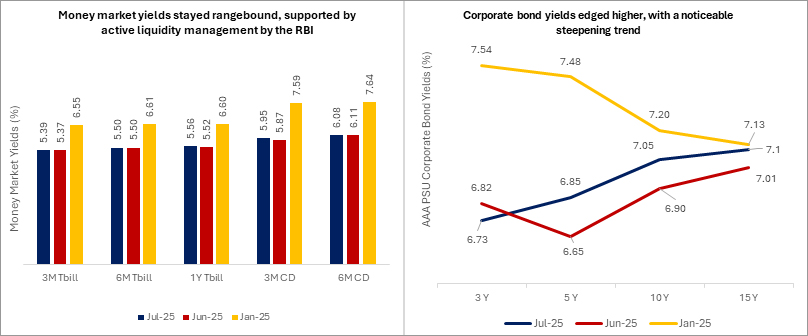
Source: Bloomberg. Quantum AMC Graphics. Above data is for the month ended July 2025, June 2025 (1 month ago) and January 2025 (6 months ago). Data on corporate bond yields is for AAA PSU corporate bonds.
The corporate bond yield curve has also moved up in line with the up move in the G-sec yields, with the spread widening slightly across the curve. By end-July 2025, the spread between 10-year corporate bonds and G-secs widened to nearly 70-85 bps, while the 15-year spread compressed to 42 bps, down from 53 bps in May. Demand for corporate bonds remains strong, supported by a steady supply pipeline.
Liquidity management has been focused on enhancing transmission of the rate cuts with RBI infusing substantial durable liquidity since December 2024.
As of July 31, system liquidity closed at a surplus of INR 2.8tn (~1.3% of NDTL). Core Liquidity as of July 18, 2025 stood at Rs 5.4 trillion.
Initially, the surplus narrowed due to GST outflows, but month-end government spending widened it again. The RBI has been consistent with its VRR and VRRR auctions. While the amount was not large and it seems they did this VRRR to put a floor on money market rates which were beginning to fall below SDF (Standing Deposit Facility) rate.
However, we do not see this as a signal towards the end of the rate cut cycle or liquidity tightening but just a hint that the bar for further rate cuts is very high - with further rate cuts possible if growth underperforms or inflation falls below the RBI’s forecast.
Liquidity is expected to remain comfortable at the start of the month due to government spending, benefiting overnight rates. However, currency demand and seasonal government balance changes could tighten conditions later.
Chart VII: Banking system liquidity in surplus; Core liquidity too in a surplus ~ 5.4 trillion
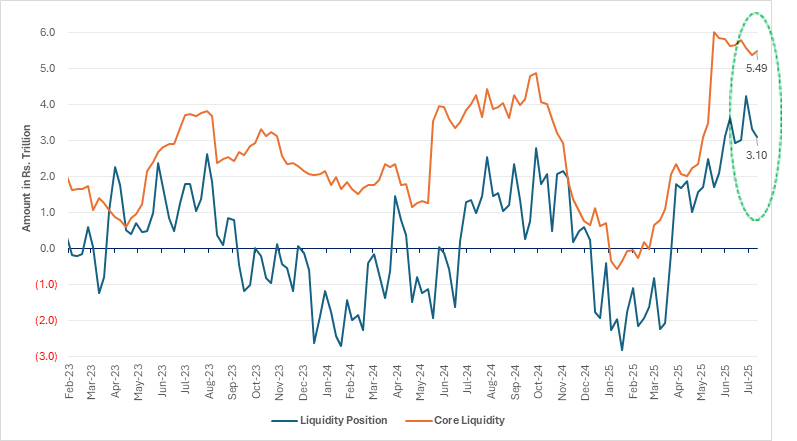
Source: RBI. Quantum AMC Graphics. Data up to the week ended July 18, 2025
Foreign investments in (Indian Government Bond) IGBs saw significant growth in July 2025, with the Fully Accessible Route (FAR) segment attracting Rs 495 million. However, this momentum faces risks amid rising global trade tensions under the Trump administration, increasing crude oil prices, and concerns about a potential pause in the RBI's rate-cut cycle, which have heightened caution and led to net outflows.
Looking ahead, in the medium term, global financial markets are expected to see reduced volatility. The USD is likely to stabilize within its current range, which could trigger a reversal of the safe-haven trade, boosting capital flows into emerging markets like India.
Chart VIII: Global Jitters Drive Foreign Outflows from Indian Bonds; July Marks a Modest Rebound
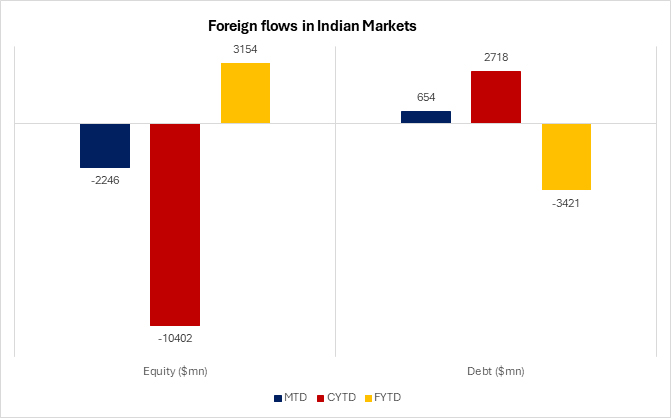
Source: CCIL. Quantum AMC Graphics. Data up to the month ended July 2025.
Other highlights during the month:
1. India – UK FTA: India and the UK have just wrapped up a major bilateral FTA (Free Trade Agreement) trade deal aiming to double their trade to $120 billion by 2030. The deal promises comprehensive market access for Indian goods, with 99% of tariff lines set to be eliminated, benefiting sectors like IT, financial services, and education. Indian workers temporarily in the UK will also get a break from social security contributions for up to three years. Tariffs on UK exports like whisky, cosmetics, and medical devices will be slashed, with reductions expected on 90% of tariff lines over time.
Key stats: The UK is India's 4th largest export partner with exports totaling $14.5 billion in FY25, while imports from the UK reached $7.3 billion in FY24. This deal is expected to boost India’s exports, FDI, and could push for quicker trade agreements with other nations, making it a win for both sides!
2. US FOMC July 2025: The Fed held its policy rate steady at 4.25–4.5%, citing a “solid” labor market and inflation that remains “somewhat elevated.” Its forward guidance leaned slightly hawkish, emphasizing a data-dependent approach to future policy moves. A potential rate cut in September remains uncertain, with markets currently assigning a 60.8% probability to the Fed keeping rates unchanged.
Outlook
Monetary policy expectations: We don’t expect the RBI to cut repo rates in August 2025 monetary policy meet—or even in October. Right now, the central bank is in wait-and-watch mode, especially with the monsoon and food inflation still playing out.
But come December, things could change. Inflation is falling faster than expected, growth is stable, and the RBI has already started adding liquidity to the system through a phased CRR cut. By December, the impact of earlier rate moves will be clearer, and global uncertainty—like what the U.S. Fed does next—should also be more settled.
Put simply, if inflation stays low and liquidity improves, December could be the right time for the RBI to make its next move.
The medium-term view on Indian debt markets remains broadly constructive, though not without near-term challenges. The RBI is expected to maintain a data-dependent approach, and with the rate-cutting cycle likely nearing its end—potentially by December 2025—bond yields may stay range-bound and volatile in the short run. That said, we see a gradual steepening bias emerging in the yield curve.
India’s macro fundamentals continue to be resilient. Fiscal discipline is intact, and the demand-supply balance remains favorable, especially with the boost from India's inclusion in global bond indices. However, external risks, such as inflation surprises, trade disruptions, or geopolitical tensions, could pose intermittent headwinds.
Despite short-term volatility, our constructive medium-term outlook is supported by:
- Reduced net G-sec supply due to fiscal prudence,
- Steady demand from long-term domestic investors,
- Ongoing global bond index inclusion momentum.
In line with this view, and with limited room for further rate cuts, we are shortening portfolio duration, tilting toward short-term bonds to safeguard capital and better navigate a likely consolidation phase in bond markets.
What can investors do?
Given the current environment, bond yields are likely to either decline or remain range-bound. In such a volatile interest rate landscape, investors with a medium to long-term horizon may consider dynamic bond funds. These funds offer the flexibility to actively manage portfolio duration, allowing adjustments in response to evolving market conditions—making them well-suited for staying invested over longer periods.
For those with shorter investment horizons or lower risk appetite, liquid funds continue to be a more appropriate choice, offering stability and easy access to funds.
Source: Reserve Bank of India (RBI), Ministry of Statistics & Program Implementation (MOSPI), Bloomberg
 |
Disclaimer, Statutory Details & Risk Factors:The views expressed here in this article / video are for general information and reading purpose only and do not constitute any guidelines and recommendations on any course of action to be followed by the reader. Quantum AMC / Quantum Mutual Fund is not guaranteeing / offering / communicating any indicative yield on investments made in the scheme(s). The views are not meant to serve as a professional guide / investment advice / intended to be an offer or solicitation for the purchase or sale of any financial product or instrument or mutual fund units for the reader. The article has been prepared on the basis of publicly available information, internally developed data and other sources believed to be reliable. Whilst no action has been solicited based upon the information provided herein, due care has been taken to ensure that the facts are accurate and views given are fair and reasonable as on date. Readers of this article should rely on information/data arising out of their own investigations and advised to seek independent professional advice and arrive at an informed decision before making any investments. Mutual Fund investments are subject to market risks, read all scheme related documents carefully. |
View All
Related Posts
-

Debt Monthly for May 2026
Posted On Monday, May 04, 2026
India’s debt markets heading into May 2026 appear set to remain range-bound, albeit with underlying fragility.
Read More -

Debt Monthly for April 2026
Posted On Wednesday, Apr 01, 2026
The month of April opens with India’s bond markets caught in the crosscurrents of global turmoil.
Read More -

Debt Monthly for March 2026
Posted On Monday, Mar 02, 2026
As FY26 draws to a close, India’s bond markets sit at the crossroads of macro stability
Read More

