Equity Monthly for September 2025
Posted On Wednesday, Sep 03, 2025

Markets declined in the month of August 2025 amid global trade tensions. The decline was relatively higher in the small and mid cap segments. Some of the key developments in August were:
- Global trade tensions continued. U.S. imposed an additional 25% duty on prevailing tariff of 25%.
- RBI left the key interest rates unchanged and maintained a neutral stance.
- The Government announced plans to rationalize GST which could provide a much needed consumption boost.
- GDP print was better than general expectations, partly aided by a low base.
- Globally, the Fed indicated the start of interest rate cuts starting from September 2025.
Table 1: Performance of Major Indices during the Month
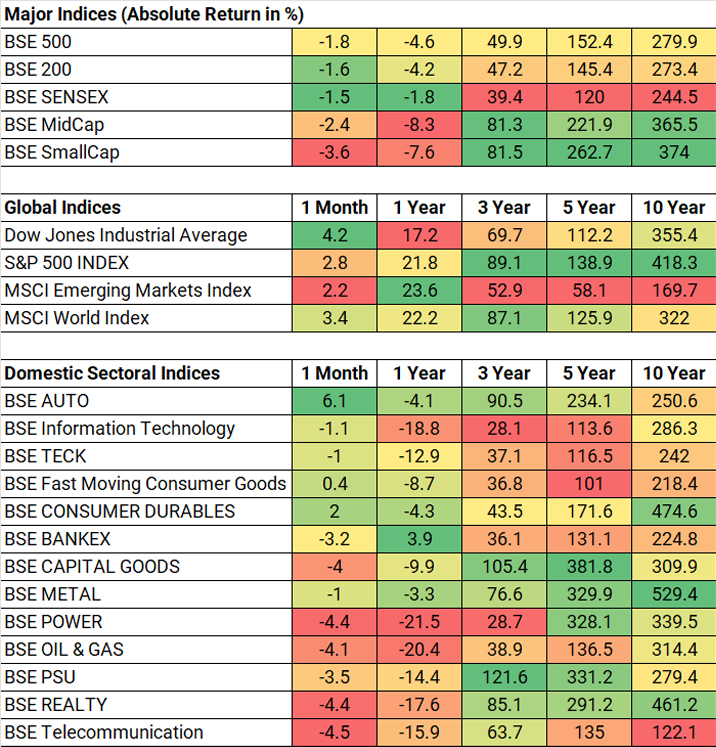
Source: Bloomberg, Data as of 31 August, 2025
Past performance may or may not be sustained in the future.
As shown in the table (Refer Table 1), consumption-oriented indices like BSE Auto & BSE Consumer Durables saw a hope rally on the back of potential GST rationalization. Compared to the broader markets, IT index also relatively outperformed as the Fed indicated the start of easing cycle along with valuations turning favorable.
On the global front, the US (S&P 500 Index) continued its rising trend on imminent hopes of rate cuts; MSCI Emerging Market Index recorded reasonable performance supported by China.
DII Flows have remained resilient:
The flows into equities remained resilient with strong DII (Domestic Institutional Investors) participation. IPO pipeline remains robust which could benefit from the robust retail flows. FPI flows continued to be negative driven by valuation constraints in India and tariff uncertainty.
Table 2: Institutional Flows
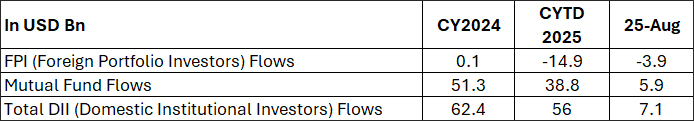
Source: NSDL, SEBI, Data as of 22 August, 2025
Markets Drove On Hopes of Consumption Boost
The Prime Minster announced on August 15 to rationalize GST that could simplify the tax system by reducing the number of GST slabs from the current multiple rates to primarily two main slabs of 5% and 18%. A new 40% rate could be introduced on sin and luxury goods. Lower GST rates on the key sectors like Auto can improve affordability and provide a boost to the economy. Though the Prime Minister indicated a roll out by Diwali, it could be challenging to reach a consensus from the Central and State Governments. States heavily dependent on GST revenue may oppose rate cuts, fearing financial shortfalls.
Demand Environment Continues To Be Benign
Graph 1: Trend of Corporate Profitability for Larger Listed Universe (% YOY)
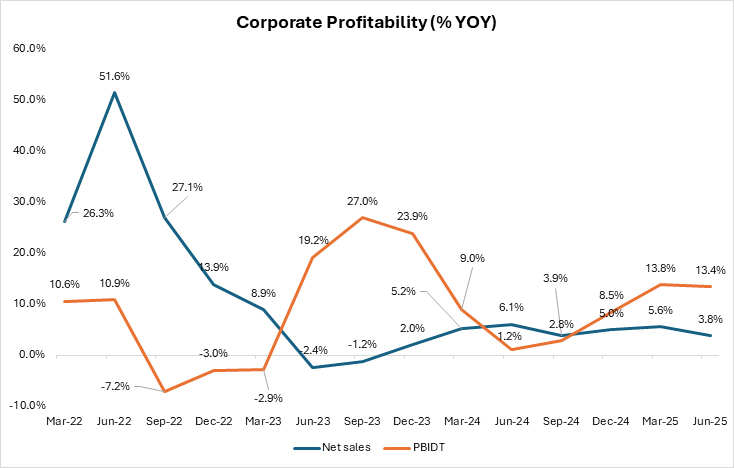
Source: CMIE; Quarterly Data as of 30 June, 2025; Net Sales and PBIDT (Profit Before Interest, Depreciation and Taxes) growth is considered.
Graph 2: Aggregate Sales Growth & PBIDT Margin of BSE 500 Index
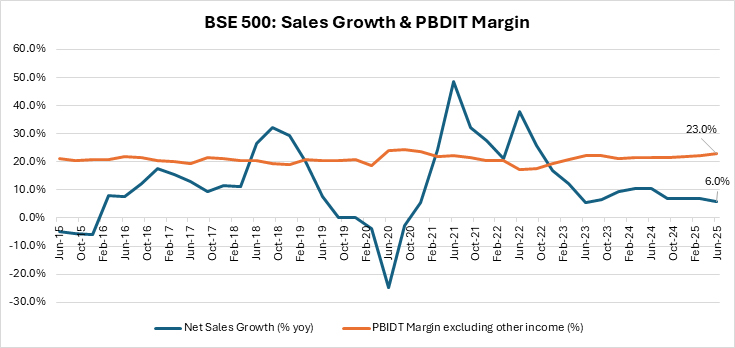
Source: Ace Equity, Data as of June 2025; PBIDT: Profit Before Interest, Depreciation and Taxes.
Table 3: Consensus Earnings Continues To be Modest In The Near Term
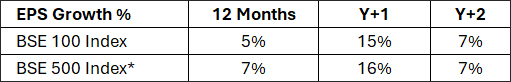
Source: Bloomberg; Data as of 31 August, 2025. *BSE 500 has limited analyst coverage due to the larger universe. Y+1 & Y+2 represents 1 year forward and 2 years forward estimates.
Table 4: Credit growth has moderated, and Fresh Term Deposit Rates are coming down
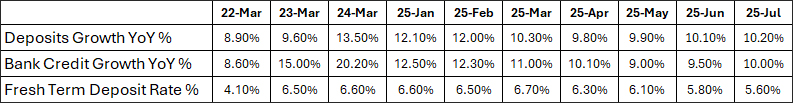
Source: Reserve Bank of India, Data as of 30 July, 2025.
Auto:
- PV (Passenger Vehicle) and 2-Wheeler segments are going through an inventory correction because of which the volume growth is tepid. The tractor segment is showing an improvement on the back of a good harvest season. CV (Commercial Vehicle) remains weak, indicating subdued economic trends. Most of the reported results were in line with these broader trends.
Table 5: Domestic Auto Sales (% YOY)

Source: Society of Indian Automobile Manufacturers, Tractor and Mechanization Association; Data as of July 2025; Quarterly data is considered for LCVs (Light Commercial Vehicle) and MHCVs (Medium & Heavy Commercial Vehicles).
IT Services:
Table 6: Deal wins remain Subdued
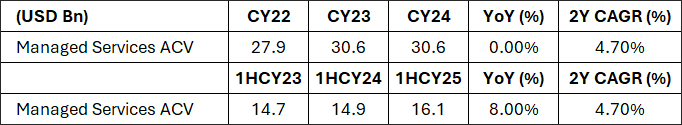
Source: ISG (Information Services Group). Calendar Year Data as of December 2024.
- Most IT Services are witnessing weak demand trends owing to macro uncertainty in the U.S. The deal wins and growth are reflective of the same.
- Median Constant currency Revenue growth over the past 2 years for large IT services players is ~2.5% CAGR. IT services can be cyclical and clearly the current global backdrop has delayed the recovery. In our view, fundamental drivers of IT sourcing like onsite offshore cost arbitrage; efficiency play and delivering at scale still hold true. All these propositions remain relevant. Given these positives, we expect a recovery in growth for these companies.
While economic backdrop is favorable; high frequency indicators do not suggest pickup in Growth
Majority of high frequency indicators don’t suggest a material improvement from the ongoing slowdown. Near-term growth could be driven by higher rural consumption and government capex spends. Moonsoon was reasonably good in the current season. Combination of this with higher MSP (Minimum Support Price) being offered by the Government; should help sustain rural recovery. The lower interest rate regime is conducive for private sector capex; but uncertainty around tariff may keep the corporates on the fences.
Table 7: Growth in Core Industries and GST Collection
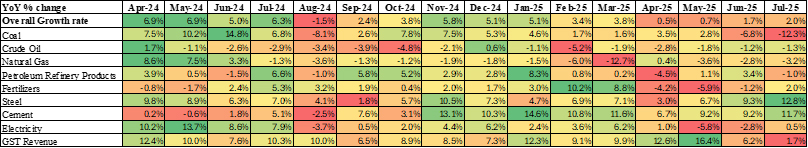
Source: Office of Economic Advisor, Data as of July 2025
Graph 3: New Investments Announcements have declined; share of private sector projects under implementation is inching up majorly aided by power projects
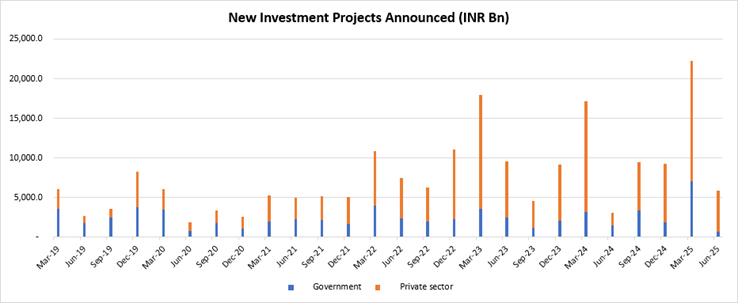
Source: CMIE, Quarterly Data as on 30 June, 2025
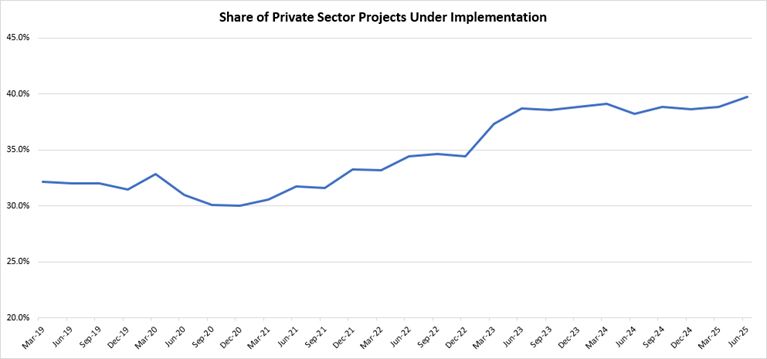
Source: CMIE, Data as of 30 June, 2025
Table 8: Residential Real Estate Sales are moderating on a high base; Home affordability remains attractive
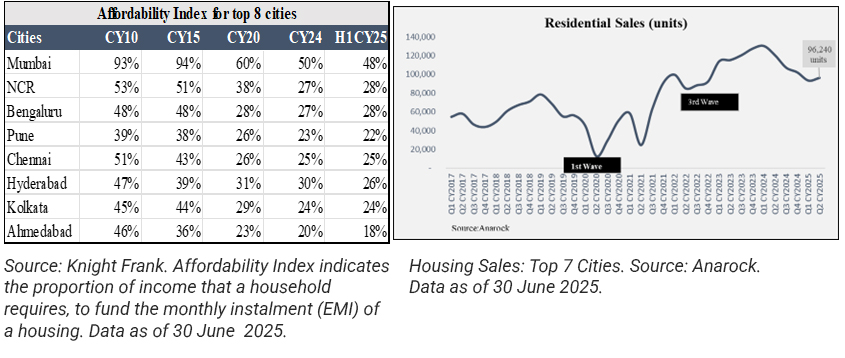
Source: CMIE, Quarterly Data as on 30 June, 2025
Graph 4: Naukri Jobspeak Index highlights subdued hiring environment in IT Services
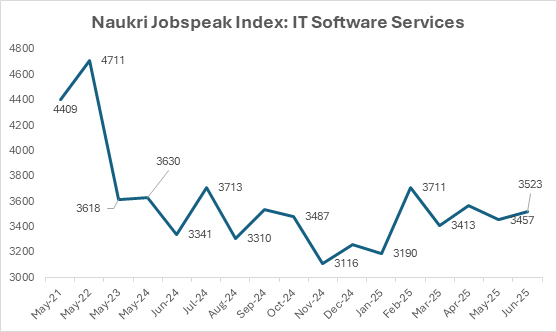
Source: Naukri Jobspeak Index, Data as of 30 June, 2025.
While the near-term economic trend is gradually recovering; valuations appear reasonable in pockets within the large cap space (Refer Table 9 and Graph 5). Benign inflation across food and fuel segments could keep inflation contained in the medium term. The recent interest rate cuts, benign inflation, good monsoon and potential consumption boost from tax cuts augurs well for the economy over the medium term. While current valuation levels may not offer potential for super normal returns, risk reward appears reasonable for a long-term investor.
Table 9: Current Vs Historic Valuations of major indices
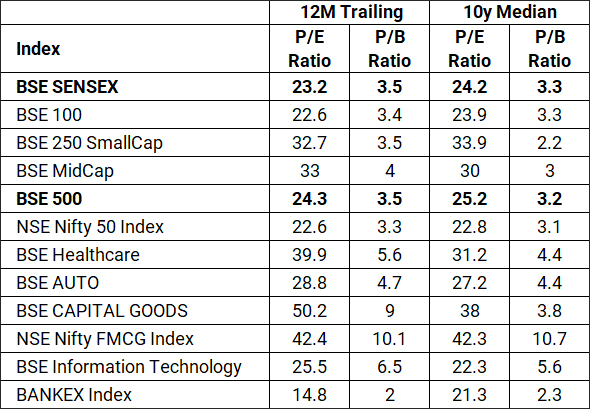
Source: Bloomberg; P/E: Price to Earnings; P/B: Price to Book; Data as of 31 August, 2025
Past performance may or may not be sustained in the future.
Graph 5: Long Term Valuation Chart of BSE Sensex Around Historic Average
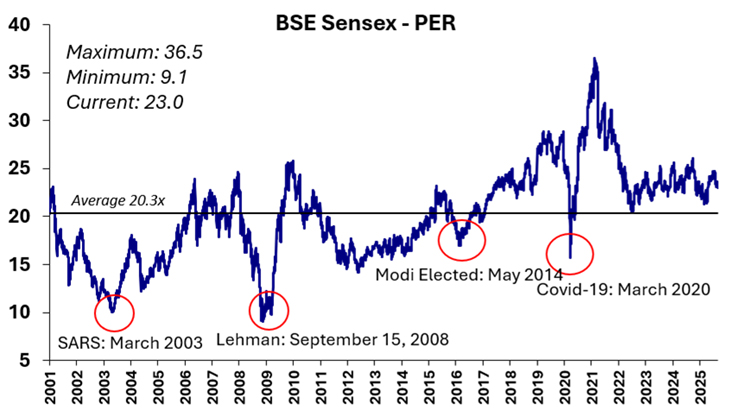
Source: Bloomberg; Data as of 31 August, 2025
Past performance may or may not be sustained in the future.
 |
Disclaimer, Statutory Details & Risk Factors:The views expressed here in this article / video are for general information and reading purpose only and do not constitute any guidelines and recommendations on any course of action to be followed by the reader. Quantum AMC / Quantum Mutual Fund is not guaranteeing / offering / communicating any indicative yield on investments made in the scheme(s). The views are not meant to serve as a professional guide / investment advice / intended to be an offer or solicitation for the purchase or sale of any financial product or instrument or mutual fund units for the reader. The article has been prepared on the basis of publicly available information, internally developed data and other sources believed to be reliable. Whilst no action has been solicited based upon the information provided herein, due care has been taken to ensure that the facts are accurate and views given are fair and reasonable as on date. Readers of this article should rely on information/data arising out of their own investigations and advised to seek independent professional advice and arrive at an informed decision before making any investments. Mutual Fund investments are subject to market risks, read all scheme related documents carefully. |
View All
Related Posts
-

Equity Outlook - July 2026
Posted On Wednesday, Jul 01, 2026
Indian equities recovered in the month of June, as the West Asia crisis showed signs of de-escalation.
Read More -

Equity Outlook - June 2026
Posted On Monday, Jun 01, 2026
Markets were marginally higher in the month of May. Following table shows the change in broad market cap indices.
Read More -

Equity Outlook - May 2026
Posted On Monday, May 04, 2026
Markets rebounded sharply from the lows of March after announcement of ceasefire. Following table shows the change in broad market cap indices.
Read More

