Equity Monthly for October 2025
Posted On Friday, Oct 03, 2025

Markets bounced back in the month of September with Sensex gaining 0.6%. BSE mid and small cap indices rose by 0.7% and 1.6% respectively.
Some of the key developments during the month were:
- Global trade tensions continue to pose risk to global growth. Federal Reserve cut interest rates by 25bps.
- US administration has published rules to amend H1B process and made changes to lottery process which will result in IT hiring decisions for corporates.
- Government implemented simplified GST rates from 22nd September; we view this as much needed simplification which can provide the much-needed consumption boost.
Table 1: Performance of Major Indices during the Month
| Domestic Indices | 1 Month | 1 Year | 3 Year | 5 Year | 10 Year |
|---|---|---|---|---|---|
| BSE 500 | 1.2 | -5.4 | 57 | 156.8 | 288 |
| BSE 200 | 1.2 | -5.1 | 54.7 | 150.3 | 281.9 |
| BSE SENSEX | 0.6 | -3.5 | 45.6 | 125.1 | 250.1 |
| BSE Midcap | 0.7 | -8.2 | 86.3 | 222.7 | 364.8 |
| BSE SmallCap | 1.6 | -8 | 87.9 | 266.7 | 419.5 |
| Global Indices | |||||
| Dow Jones Industrial Average | 2.4 | 17.9 | 86.3 | 121.6 | 379.4 |
| S&P 500 INDEX | 3.8 | 24 | 111.5 | 157.1 | 459.1 |
| MSCI Emerging Markets Index | 7.3 | 24.5 | 81.7 | 72.1 | 202.9 |
| MSCI World Index | 3.4 | 24.2 | 108.6 | 141.3 | 359.7 |
| Domestic Sectoral Indices | |||||
| BSE Auto | 5.9 | -1.8 | 109.8 | 250.4 | 281.8 |
| BSE Information Technology | -3.6 | -19.7 | 29.9 | 86 | 258.6 |
| BSE Fast Moving Consumer Goods | -2.4 | -13.8 | 31.6 | 101.4 | 212.1 |
| BSE Consumer Durables | -4.8 | -14.4 | 37.3 | 142.3 | 458.3 |
| BSE Banks | 2.5 | 3.4 | 43 | 162.2 | 232.3 |
| BSE Capital Goods | 4.4 | -5.9 | 123.7 | 419.1 | 406.5 |
| BSE Metal | 9.5 | -1.3 | 105.5 | 400.3 | 649 |
| BSE Power | 5.3 | -21.3 | 49.2 | 352.6 | 357.9 |
| BSE Oil & Gas | 5.5 | -13.1 | 60.1 | 166.5 | 343.8 |
| BSE PSU | 8 | -5.2 | 147.7 | 425.8 | 321.1 |
| BSE Realty | -0.3 | -21.3 | 101.5 | 309.5 | 404.1 |
| BSE Telecommunication | 0.5 | -10.7 | 62.3 | 180 | 132.7 |
Source: Bloomberg, Data as of 30 September 2025
Past performance may or may not be sustained in the future.
As shown in the table (Refer Table 1), Metals, capex focused sectors (Power, Capital Goods) and select consumption-oriented indices like Auto rallied on the back of GST rationalization. Sectors such as Consumer durables and Technology trailed the index.
On the global front, the US (S&P 500 Index) continued its rising trend driven technology and MSCI Emerging Market Index rose by 9.5% driven by China.
DII Flows have remained resilient:
The flows into equities remained resilient with strong DII (Domestic Institutional Investors) participation. FPI flows continued to be negative driven by valuation constraints in India and tariff uncertainty.
Table 2: Institutional Flows
| In USD Bn | CY2024 | CYTD 2025 | 25-Aug |
|---|---|---|---|
| FPI (Foreign Portfolio Investors) Flows | 0.1 | -14.9 | -3.9 |
| Mutual Fund Flows | 51.3 | 40.3 | 7.5 |
| Total DII (Domestic Institutional Investors) Flows | 62.4 | 59.3 | 10.9 |
Some of the Key emerging themes which will impact markets are:
Table 3: Goods impacted by US Tariffs are 1.6% of India’s GDP
F| Goods Exported to US | CY 2024 (USD Bn) | % of India's Total Goods Exports | % Share of India supply in total US Imports | Tariffs on India * | Key Competing Country and their Tariff |
|---|---|---|---|---|---|
| Electronics* | 14 | 3.20% | 3.00% | 0% | China -30%, Vietnam -0% |
| Pharmaceuticals & Chemicals* | 12.5 | 2.80% | 6.00% | 0% | Ireland -15%, Switzerland -39% |
| Gems & Jewellery | 11.6 | 2.60% | 13.00% | 50% | Turkey -15%, Vietnam -20% |
| Machinery | 6.8 | 1.50% | 1.00% | 50% | China -30%, Mexico -0% |
| Textiles & Garments | 7.7 | 1.70% | 8.00% | 50% | Vietnam -20%, Bangladesh -20% |
| Iron & Steel | 3.1 | 0.70% | 4.00% | 50% | China -30%, Canada 35% |
| Others- (Motor vehicles, Marine, Plastic, and carpets etc) | 31.6 | 7.10% | - | 50% | China -30%, Vietnam -20% |
| Total | 87.3 | 19.70% | 2.00% |
* Exempt until Sec 232** investigation completes ** Sectors are impacted and customer will look for alternatives.
Source: Quantum AMC, USITC.GOV
US tariff on goods largely remains focused on specific sectors as highlighted. Sectors like Electronics and Pharma continue to be in the exempt category; other sectors such as Gems/Jewelry, Textiles, Machinery etc. are facing adverse tariffs. If the tariff persists, the impacted sectors may face profitability hit and some of them are focusing on finding new markets for the impacted goods.
Table 4: Goods and Services Tax reforms to boost GDP growth
| GST Rate Slab | GST Revenue (Rs Bn) Fiscal Year 2025 | No. of Goods pre-22nd Sep 2025 | No. of Goods From 22nd Sep 2025 |
|---|---|---|---|
| Nil | - | - | 13 |
| 5% | 1,546 | 9 | 309 |
| 12% | 1,104 | 274 | - |
| 18% | 14,352 | 61 | 51 |
| 28% | 2,429 | 46 | - |
| 18% or 28% | - | 1 | - |
| 40% | - | - | 18 |
Source: Press information Bureau, Hindustan Times, Mint
Prime Minster announced rationalization of GST rates, that could simplify the tax system by reducing the number of GST slabs from the current multiple rates to primarily two main slabs of 5% and 18%. We view this development as continuation of reform agenda and may give one-time boost to volume growth for impacted sectors. Lower GST rates in key sectors like auto can improve affordability, especially in the mass segment; this segment has been languishing due to lower wage growth and high inflation post covid.
Table 5: Monsoon has been 8% above normal, augurs well for rural India
| Region | Total live storage capacity in BCM* | Total live storage available in BCM* | % of live storage capacity | % of live storage last year | % Average storage of last 10 years |
|---|---|---|---|---|---|
| Northern | 19.85 | 12.24 | 62% | 31% | 49% |
| Eastern | 21.76 | 11.3 | 52% | 35% | 39% |
| Western | 37.36 | 27.26 | 73% | 48% | 47% |
| Central | 48.59 | 34.28 | 71% | 36% | 45% |
| Southern | 54.94 | 41.4 | 75% | 64% | 49% |
| Total/Avg | 182.5 | 126.48 | 66% | 43% | 46% |
Source: Central water commission, Data as of Sep 2025
While demand environment is improving; FY26 Earnings have seen downgrades.
Graph 1: Trend of Corporate Profitability for Larger Listed Universe (% YOY)
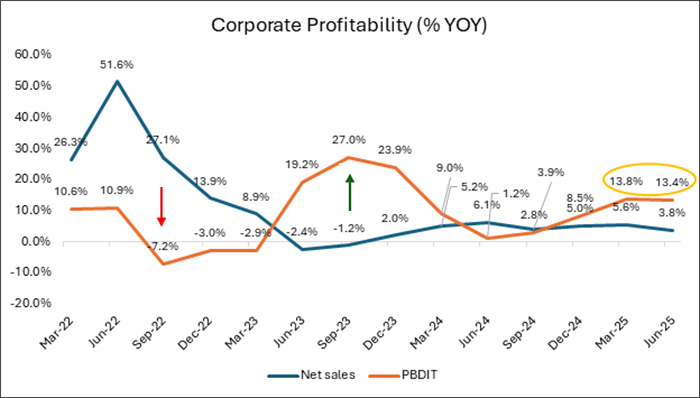
Source: CMIE; Quarterly Data as of 30 June 2025; Net Sales and PBIDT (Profit Before Interest, Depreciation and Taxes) growth is considered.
This chart tracks the trend of corporate sales growth and PBDIT (profit before depreciation, interest, and taxes) for a broad set of listed companies over time. It shows how demand (sales) and operational profitability are evolving in the equity market. Periods where sales growth exceeds profit growth may indicate rising costs or margin pressure, while the reverse suggests efficient cost management or margin expansion. By observing these trends together, investors can gauge the health of the corporate sector and how effectively companies are converting revenues into profits. Overall, it provides a clear picture of market demand and profitability dynamics over time.
Graph 2: Aggregate Sales Growth & PBIDT Margin of BSE 500 Index
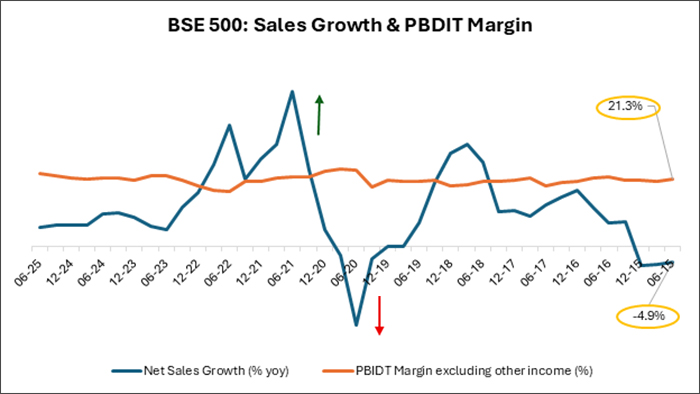
Source: Ace Equity, Data as of June 2025; PBIDT: Profit Before Interest, Depreciation and Taxes.
This chart illustrates the evolution of corporate earnings growth and operating profitability (PBDIT) for a broad set of listed companies over time. It highlights how sales and profit trends move in relation to each other, reflecting shifts in demand, cost structure, and margin dynamics. Periods where profit growth diverges from sales growth may indicate changes in efficiency, pricing power, or operating leverage. By observing these trends together, investors can gauge the overall health and performance trajectory of the corporate sector.
Table 6: Consensus Earnings Continues To Be Modest In The Near Term
| EPS Growth % | 12 Months | Y+1 | Y+2 |
|---|---|---|---|
| BSE 100 Index | 3.80% | 15.60% | 7.00% |
| BSE 500 Index* | 5.10% | 16.30% | 7.50% |
Source: Bloomberg; Data as of 30 September 2025. *BSE 500 has limited analyst coverage due to the larger universe. Y+1 & Y+2 represents 1 year forward and 2 years forward estimates.
Table 7: Credit growth has moderated, and Fresh Term Deposit Rates are coming down
| Dates \ Growth % | 24-Mar | 25-Mar | 25-Mar | 25-Jan | 25-Feb | 25-Mar | 25-Apr | 25-May | 25-Jun | 25-Jul | 25-Aug | 25-Sep |
|---|---|---|---|---|---|---|---|---|---|---|---|---|
| Deposits Growth YoY % | 8.90% | 9.60% | 13.50% | 12.10% | 12.00% | 10.30% | 9.80% | 9.90% | 10.10% | 10.20% | 9.80% | 10.00% |
| Bank Credit Growth YoY % | 8.60% | 15.00% | 20.20% | 12.50% | 12.30% | 11.00% | 10.10% | 9.00% | 9.50% | 10.00% | 10.20% | 10.30% |
Source: Reserve Bank of India, Data as of September 2025.
Auto:
• Due to GST changes and inventory correction PV volumes have been tepid. The tractor segment is showing an improvement on the back of a good harvest season. CV (Commercial Vehicle) remains weak, indicating subdued economic trends. GST cuts will help volume recovery in the near term.
Table 8: Domestic Auto Sales (% YOY)
| Domestic sales | 25-Jan | 25-Feb | 25-Mar | 25-Apr | 25-May | 25-Jun | 25-Jul | 25-Aug | FY25 (% yoy) | 2Y CAGR (%) |
|---|---|---|---|---|---|---|---|---|---|---|
| Passenger Vehicles | 3.50% | 3.70% | 0.60% | 5.50% | 0.80% | -6.30% | 1.50% | -9.00% | 5.90% | 7.00% |
| 2 wheelers | 2.20% | -8.80% | 11.40% | -16.70% | 2.20% | -3.40% | 8.70% | 7.10% | 18.60% | 16.00% |
| LCVs | -0.10% | 0.60% | -2.00% | -2.00% | ||||||
| MHCVs | 4.60% | -2.00% | 0.20% | 2.00% | ||||||
| Tractor | 11.10% | 30.90% | 21.60% | -1.90% | -1.40% | 73.10% | -5.30% | 9.50% | 12.80% | 1.00% |
Source: Society of Indian Automobile Manufacturers, Tractor and Mechanization Association; Data as of August 2025; Quarterly data is considered for LCVs (Light Commercial Vehicle) and MHCVs (Medium & Heavy Commercial Vehicles).
IT Services:
Table 9: H1B Applications
| Top 5 IT Service Companies | 2021 | 2022 | 2023 | 2024 | 2025 |
|---|---|---|---|---|---|
| H1B Applications - Share of Headcount | 2.80% | 1.50% | 0.60% | 1.30% | 0.70% |
Source: LCA filings
• In a major overhaul of H1B process, US President Donald Trump on 19 Sept signed a proclamation imposing a US$100,000 visa fee for H1B visa applications. There are additional proposals to grant higher share of H1B visa to relatively higher skilled employees. These changes will be implemented from FY27. These regulations may increase the cost of doing business for Indian IT services and end-clients.
• Over the past several years, Indian IT Services have reduced the dependence on H1B (Refer Table 6). H1B share of total headcount currently is 0.7% in FY25. In our view; these changes are manageable and eventually there can be higher offshoring and nearshoring (geographies with similar time-zone and proximity to US).
Table 10: Deal wins remain Subdued
| (USD Bn) | CY22 | CY23 | CY24 | YoY (%) | 2Y CAGR (%) |
|---|---|---|---|---|---|
| Managed Services ACV | 27.9 | 30.6 | 30.6 | 0.00% | 4.70% |
| 1HCY23 | 1HCY24 | 1HCY25 | YoY (%) | 2Y CAGR (%) | |
| Managed Services ACV | 14.7 | 14.9 | 16.1 | 8.00% | 4.70% |
Source: ISG (Information Services Group). Calendar Year Data as of December 2024.
• On the demand environment, most IT Services are witnessing weak demand trends owing to macro uncertainty in the U.S. The deal wins and growth are reflective of the same.
• Median Constant currency Revenue growth over the past 2 years for large IT services players is ~2.5% CAGR. IT services can be cyclical and clearly the current global backdrop has delayed the recovery. In our view, fundamental drivers of IT sourcing like onsite offshore cost arbitrage; efficiency play and delivery at scale still hold true. All these propositions remain relevant. Given these positives, we expect a recovery in growth for these companies.
While economic backdrop is favorable; high frequency indicators do not suggest pickup in Growth
Majority of high frequency indicators don’t suggest a material improvement from the ongoing slowdown. Near-term growth could be driven by higher rural consumption and government capex spends. Monsoon was reasonably good in the current season. Combination of this with higher MSP (Minimum Support Price) being offered by the Government should help sustain rural recovery. The lower interest rate regime is conducive for private sector capex; but uncertainty around tariff may keep the corporates on the fences.
Table 11: Growth in Core Industries and GST Collection
| YoY % change | Apr-24 | May-24 | Jun-24 | Jul-24 | Aug-24 | Sep-24 | Oct-24 | Nov-24 | Dec-24 | Jan-25 | Feb-25 | Mar-25 | Apr-25 | May-25 | Jun-25 | Jul-25 | Aug-25 |
|---|---|---|---|---|---|---|---|---|---|---|---|---|---|---|---|---|---|
| Overall Growth rate | 6.9% | 6.9% | 5.0% | 6.3% | -1.5% | 2.4% | 3.8% | 5.8% | 5.1% | 5.1% | 3.4% | 3.8% | 0.5% | 0.7% | 1.7% | 3.7% | 6.3% |
| Coal | 7.5% | 10.2% | 14.8% | 6.8% | -8.1% | 2.6% | 7.8% | 7.5% | 5.3% | 4.6% | 1.7% | 1.6% | 3.5% | 2.8% | -6.8% | -12.3% | -11.4% |
| Crude Oil | 1.7% | -1.1% | -2.6% | -2.9% | -3.4% | -3.9% | -4.8% | -2.1% | 0.6% | -1.1% | -5.2% | -1.9% | -2.8% | -1.8% | -1.2% | -1.3% | -1.2% |
| Natural Gas | 8.6% | 7.5% | 3.3% | -1.3% | -3.6% | -1.3% | -1.2% | -1.9% | -1.8% | -1.5% | -6.0% | -12.7% | 0.4% | -3.6% | -2.8% | -3.2% | -2.2% |
| Electricity | 10.2% | 13.7% | 8.6% | 7.9% | -3.7% | 0.5% | 2.0% | 4.4% | 6.2% | 2.4% | 3.6% | 6.2% | 1.0% | -5.8% | -2.8% | 3.7% | 3.1% |
| GST Revenue | 12.4% | 10.0% | 7.6% | 10.3% | 10.0% | 6.5% | 8.9% | 8.5% | 7.3% | 12.3% | 9.1% | 9.9% | 12.6% | 16.4% | 6.2% | 7.5% | 6.5% |
Source: Office of Economic Advisor, Data as of August 2025
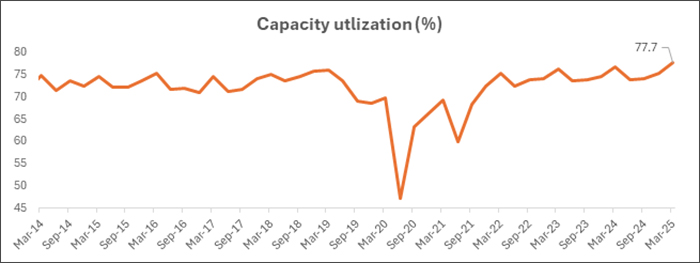
Graph 3: New order book and capacity utilization across industries suggests pick up in capex activity
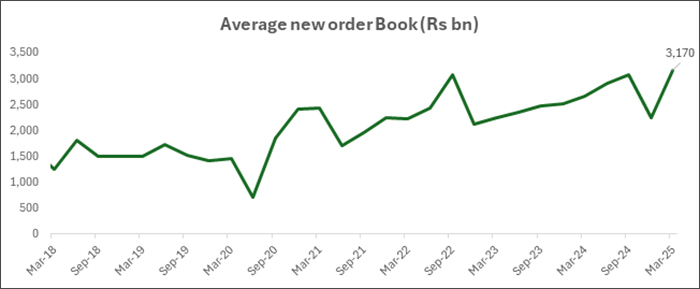
This chart shows the trend in the average new order book (in ₹ billion) for companies over time, tracking how new orders have evolved across economic cycles. It illustrates the pace of incoming business or demand that firms are securing, which can be an early indicator of future revenue flows. Periods of rising order books suggest strengthening demand and potential growth ahead, while dips can signal softening demand or delays in new contracts. By observing this trend, investors can gauge shifts in business activity and market confidence before those orders translate into sales and profits. Overall, it provides insight into the momentum of corporate demand conditions over the long run.
Source: CMIE Economic Outlook, RBI Industrial Survey, Data Up to March 2025
This chart shows the trend in capacity utilization (%) for the corporate sector over time, indicating how fully firms are using their production capabilities. Higher utilization suggests that companies are running closer to full production capacity, reflecting stronger demand and operational activity. Periods of lower utilization, especially sharp dips, can signal weak demand, production cutbacks, or economic slowdowns. Tracking capacity utilization helps gauge the business cycle and supply‑side pressures within the economy. Overall, the chart provides insight into how efficiently companies are deploying their productive resources over time.
Table 12: Residential Real Estate Sales are moderating on a high base; Home affordability remains attractive
| Affordability Index for Top 8 Cities | |||||
|---|---|---|---|---|---|
| Cities | CY10 | CY15 | CY20 | CY24 | 1H25 |
| Mumbai | 93% | 94% | 60% | 50% | 48% |
| NCR | 53% | 51% | 38% | 27% | 28% |
| Bangalore | 48% | 48% | 28% | 27% | 28% |
| Pune | 39% | 38% | 26% | 23% | 22% |
| Chennai | 51% | 43% | 26% | 25% | 25% |
| Hyderabad | 47% | 39% | 31% | 30% | 26% |
| Kolkata | 45% | 44% | 29% | 24% | 24% |
| Ahmedabad | 46% | 36% | 23% | 20% | 18% |
Source: Knight Frank. Affordability Index indicates the proportion of income that a household requires, to fund the monthly instalment (EMI) of a housing. Data as of 30 June 2025.
Table 13: Residential Demand Supply Top 7 Cities
| Residential Demand/Supply Top 7 Cities (No of Units) | Q3 CY2024 | Q4 CY2024 | Q1 CY2025 | Q2 CY2025 | Q3 CY2025 | TTM YoY% | 2Yr TTM CAGR |
|---|---|---|---|---|---|---|---|
| Launches (YoY) | -19% | -23% | -10% | -16% | 3% | -12% | -4% |
| Sales (YoY) | -11% | -20% | -28% | -20% | -9% | -20% | -6% |
| Inventory Overhang in Months | 16 | 16 | 18 | 18 | 17 |
Source: Anarock, Housing Sales – Top 7 Cities
Graph 4: Naukri Jobspeak Index highlights subdued hiring environment in IT Services
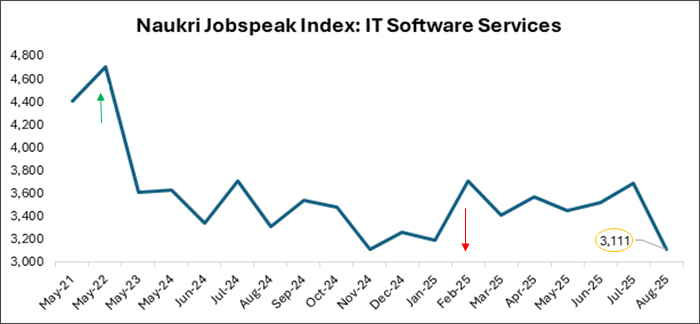
Source: Naukri Jobspeak Index, Data as of 31 August 2025.
This chart tracks the Naukri JobSpeak Index for the IT Software Services sector, a monthly measure of hiring activity and job demand based on new job listings and recruiter searches in India’s formal job market. It shows how IT sector hiring trends have evolved over time, with higher index values indicating stronger recruitment activity and broader demand for IT professionals, and lower values suggesting slower hiring momentum. Movements in this index can reflect underlying business confidence and demand for tech talent within the economy. By observing this trend, investors and analysts can gauge shifts in the employment health of the IT services industry, which often signals broader demand conditions in the corporate sector.
While the near-term economic trend is gradually recovering; valuations appear reasonable in pockets within the large cap space (Refer Table 14 and Graph 5). Benign inflation across food and fuel segments could keep inflation contained in the medium term. The recent interest rate cuts, benign inflation, good monsoon and potential consumption boost from tax cuts and GST rationalization augurs well for the economy over the medium term. While current valuation levels may not offer potential for super normal returns, risk reward appears reasonable for a long-term investor.
Table 14: Current Vs Historic Valuations of major indices
| Index | 12M Trailing | 10y Median | ||
|---|---|---|---|---|
| P/E Ratio | P/B Ratio | P/E Ratio | P/B Ratio | |
| BSE SENSEX | 23.8 | 3.5 | 24.1 | 3.3 |
| BSE 100 | 23.9 | 3.4 | 23.9 | 3.3 |
| BSE 250 SmallCap | 32.3 | 3.5 | 34.1 | 2.2 |
| BSE MidCap | 34.8 | 4 | 29.6 | 2.7 |
| BSE 500 | 25.5 | 3.5 | 25.1 | 3.2 |
| NSE Nifty 50 Index | 23.7 | 3.4 | 22.6 | 3.1 |
| BSE Healthcare | 43.4 | 5.4 | 31.2 | 4.4 |
| BSE AUTO | 28.2 | 4.2 | 26.8 | 4.3 |
| BSE CAPITAL GOODS | 48.1 | 7.5 | 38 | 3.8 |
| NSE Nifty FMCG Index | 44.2 | 10 | 42 | 10.7 |
| BSE Information Technology | 28.8 | 6.9 | 21.8 | 5.2 |
| BANKEX Index | 15.1 | 2 | 21.3 | 2.3 |
Source: Bloomberg; P/E: Price to Earnings; P/B: Price to Book; Data as of 30 September, 2025
Past performance may or may not be sustained in the future.
Graph 5: Long Term Valuation Chart of BSE Sensex Around Historic Average
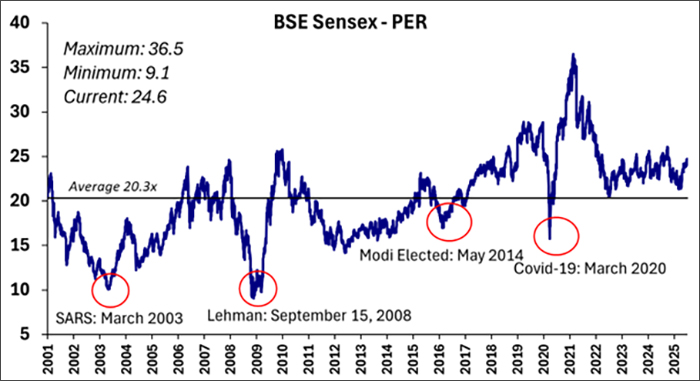
Source: Bloomberg; Data as of 30 September 2025
This chart tracks the Price-to-Earnings Ratio (P/E) of the BSE Sensex from 2001 to 2025, a key valuation metric comparing stock prices to earnings. Higher P/E values suggest expensive markets, while lower values indicate undervaluation or stress. The ratio has ranged from about 9.1 to 36.5, with a long-term average near 20.3 and a current level around 24.6, indicating moderately high valuations. Major events like the SARS outbreak (2003) and the Lehman Brothers collapse caused sharp declines in valuations. Overall, the chart highlights how economic shocks and policy changes influence market sentiment over time.
Past performance may or may not be sustained in the future.
Disclaimer, Statutory Details & Risk Factors:
The views expressed here in this article / video are for general information and reading purpose only and do not constitute any guidelines and recommendations on any course of action to be followed by the reader. Quantum AMC / Quantum Mutual Fund is not guaranteeing / offering / communicating any indicative yield on investments made in the scheme(s). The views are not meant to serve as a professional guide / investment advice / intended to be an offer or solicitation for the purchase or sale of any financial product or instrument or mutual fund units for the reader. The article has been prepared on the basis of publicly available information, internally developed data and other sources believed to be reliable. Whilst no action has been solicited based upon the information provided herein, due care has been taken to ensure that the facts are accurate and views given are fair and reasonable as on date. Readers of this article should rely on information/data arising out of their own investigations and advised to seek independent professional advice and arrive at an informed decision before making any investments.
Mutual fund investments are subject to market risks read all scheme related documents carefully.
View All
Related Posts
-

Equity Monthly for April 2026
Posted On Wednesday, Apr 01, 2026
Markets reacted negatively to the persistent West Asia crisis. Following table shows the change in broad market cap indices.
Read More -

Equity Monthly for March 2026
Posted On Monday, Mar 02, 2026
Markets were range bound with a marginal decline in Sensex. BSE mid and small cap indices
Read More -

Equity Monthly for February 2026
Posted On Monday, Feb 02, 2026
Markets continued to be under pressure with Sensex declining by 3.4%.
Read More

