Discovering Certainty in an Uncertain World
Posted On Tuesday, Feb 27, 2024
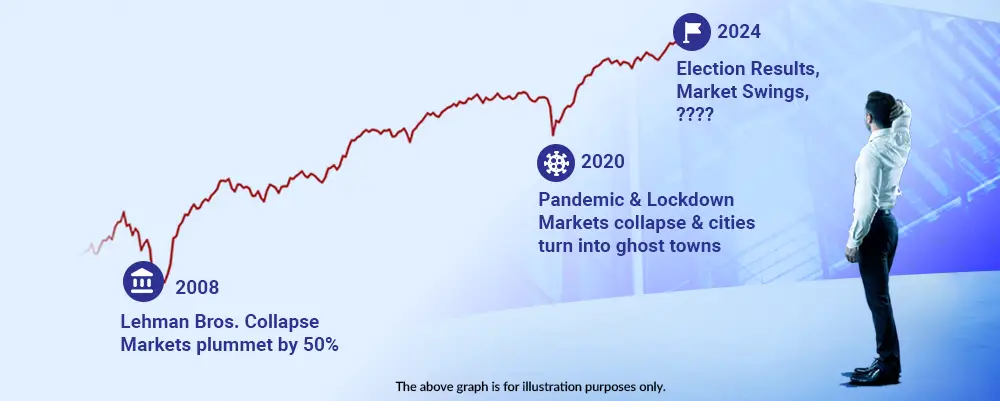
Where Were You When The Lights Went Out?
Were you worried about your investments when...
Lehman declared Bankruptcy, Sept 15th, 2008 and markets plummeted by 50%?
Or when the COVID Pandemic hit, March 2020, and cities turned into ghost towns and markets collapsed in a span of days?
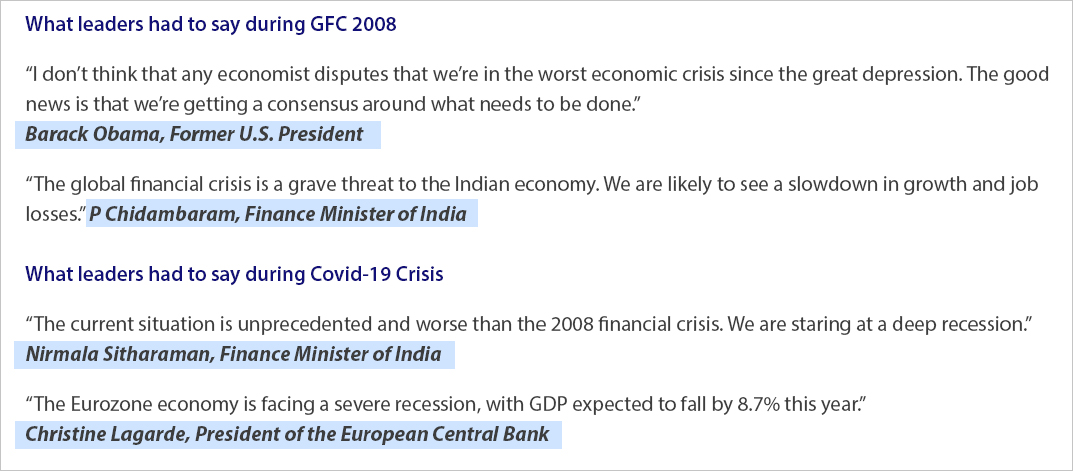
When the world faced these crises even global leaders did not have clarity on the way forward. Financial experts struggled to make sense of the chaos unfolding around them and were unsure of how to tackle the panic and uncertainty that gripped investors worldwide.
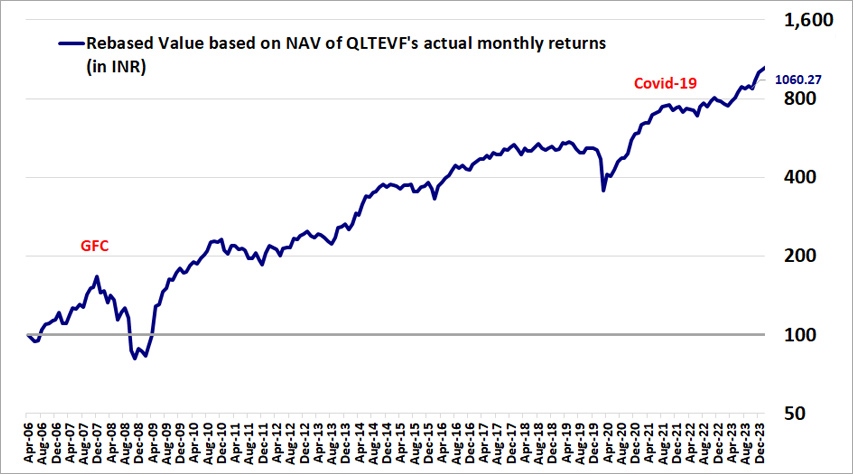
However at Quantum, we have always believed that a steadfast investment approach backed by disciplined research & investment process can help you navigate such crises and safeguard your portfolio in turbulent times. While the world seemed to shake & markets collapsed, Quantum had strong conviction in its portfolio and believed in its potential. A visual testament of this belief is our Unique Upside Potential chart calculated every month since April 2008, that estimates the Gross NAV of our Portfolio looking out 2 years into the future.
Upside Potential Predicted 2-year Estimates (Gross) v/s Actual Net 2-year Returns
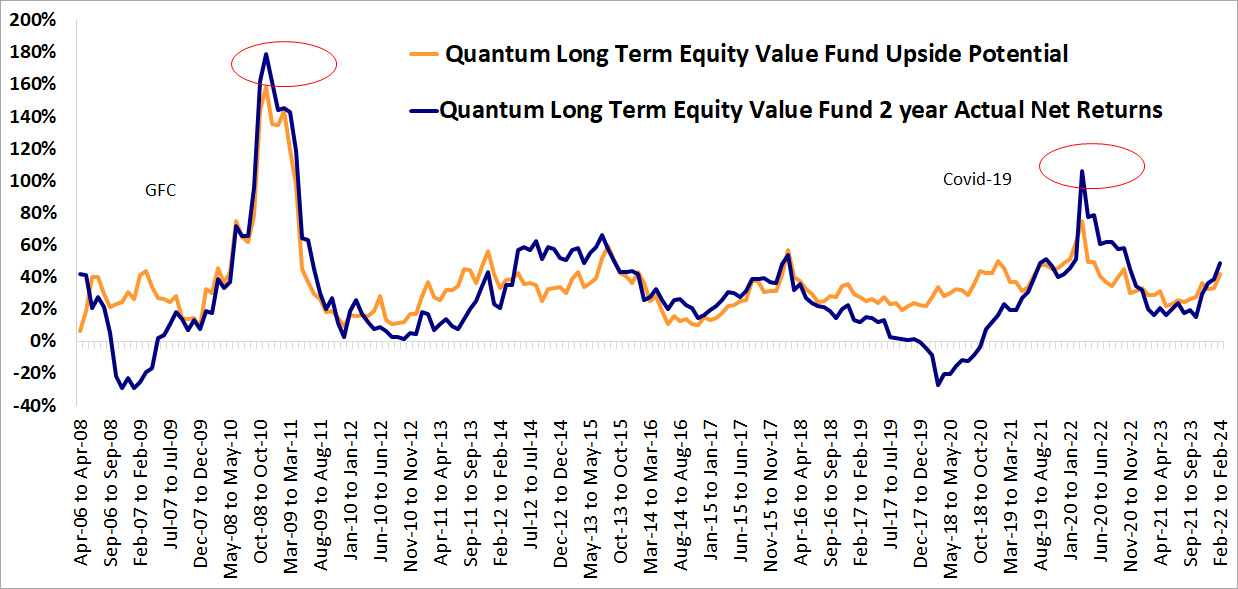
Actual Vs Projected Upside During Crisis Period | Nov-08 | Mar-20 |
Projected Upside Potential | 158.60% | 75.20% |
2 yr Actual Return | 179.30% | 106.10% |
The above graph shows the estimate of rebased GAV of Quantum Long Term Equity Value Fund – Direct Plan – Growth Option on the basis of Upside Potential of the portfolio (equal to the sum total of weight of each stock (multiplied by) the percentage difference between the current market price and the sell limits assigned to each stock in the portfolio by the in-house research teams). The performance returns are net of fees and expenses, and assuming reinvestment of all dividends and other earnings. Past performance may or may not be sustained in the future.
The value axis for graph 2 has been plotted based on logarithmic scale of 2. Source: Internal Research, Bloomberg Finance L.P.
Source: Quantum AMC, As of February 29th, 2024
2008 GFC : Markets plummeted 50%, but our Unique Upside Potential chart predicted a %158.60 increase in the 2-year estimates. Reality was sweeter with a 179.30% increase in actual net returns as of Nov 2010 backed by a robust stock selection process with risk management controls as regards integrity, valuations and liquidity. With a disciplined buy-sell criteria, Quantum Mutual Fund not only met but also exceeded its estimated potential on a 2 year basis.
2020 Covid-19 Crisis: While Global markets collapsed, Quantum remained resolute in its belief in the long-term potential of the market. The fund house maintained its conviction that the markets would eventually rebound, and investors would reap the rewards of patience and foresight. Rightfully so, the actual outcome turned out to be much better than projected upside potential. While the projection was 75% Quantum Mutual Fund delivered 106% increase in returns by Mar 2022.
Our predictive power ensured that we were stirred, not shaken by two massive Global Macro Events: GFC and Covid.
Consistently Delivering on our Unique Upside Potential, Since inception
Since 2008, we've calculated the Gross NAV of our portfolio 2 years into the future, offering a glimpse of the upside potential and actual delivered. Here's how it played out:
- Estimated Increase: 10.1 x in 17 years (13.8% CAGR)
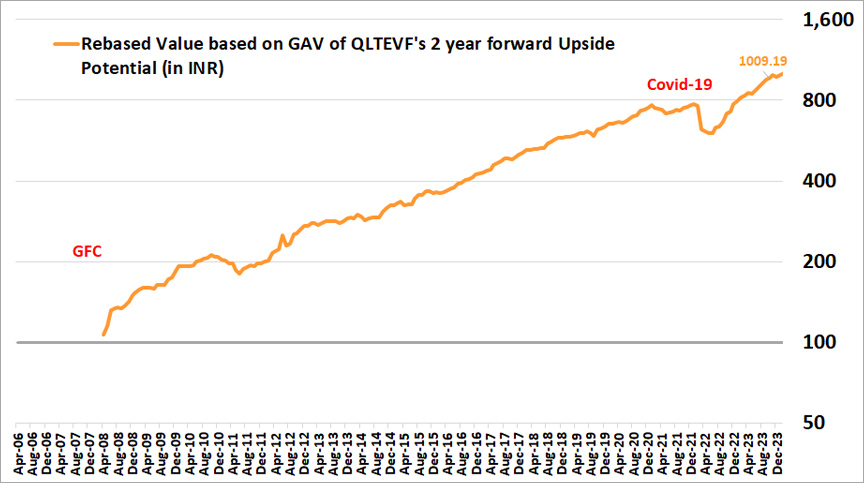
The above graph shows the estimate of rebased GAV of Quantum Long Term Equity Value Fund – Direct Plan – Growth Option on the basis of Upside Potential of the portfolio (equal to the sum total of weight of each stock (multiplied by) the percentage difference between the current market price and the sell limits assigned to each stock in the portfolio by the in-house research teams).
Past performance may or may not be sustained in the future.
The value axis for graph 2 has been plotted based on logarithmic scale of 2. Source: Internal Research, Bloomberg Finance L.P., As of February 29th, 2024
- Actual Increase: 10.6 x in 17 years (14.1% CAGR)
The performance returns are net of fees and expenses, and assuming reinvestment of all dividends and other earnings.
Past performance may or may not be sustained in the future.
The value axis for graph 2 has been plotted based on logarithmic scale of 2. Source: Internal Research, Bloomberg Finance L.P., As of February 29th, 2024.
Through boom and bust, bull and bear markets, Quantum has remained a beacon of stability in a sea of uncertainty.
This is because Quantum Mutual Fund has focused on a rigorous, integrity driven disciplined research and bottom-up stock selection process to:
- Identify undervalued companies with strong fundamentals & integrity.
- Set clear buy-sell limits to control risk.
- Estimate "Upside Potential" to estimate future performance.
Essentially, Quantum Mutual Fund selects companies trading at a 25-40% discount to its 2-year forward intrinsic value, coupled with catalysts for realizing their estimated upside potential.
For instance, assuming an analyst believes that the intrinsic value of the company is Rs. 100 FY2e
Quantum Mutual Fund buys stock today at a 25% discount that is = Rs. 75
If we are right, Potential Upside = 25/75 = 33.3% over 2 years
= 15.5% CAGR, without expenses and fees
Navigating Market Swings with Confidence
In the current times, uncertainties such as market swings, inflation, geopolitical uncertainty & global slowdown dominate the investing landscape. As the political landscape heats up, it is natural to be concerned about its potential impact on equity markets and it’s difficult to predict market reaction. The key to weathering any uncertainty lies in adopting an investment strategy that offers predictability of outcomes with an ability to manage downside risk better.
We believe that our time-tested investment process to estimate Upside Potential can help navigate market volatility & achieve predictable outcomes even in the most uncertain of times. The certainty of outcome is the result of a disciplined research and bottom-up stock selection process that identifies opportunities that are undervalued relative to historical performance. The Quantum Long Term Value Fund is mindful of valuations by setting pre-defined buy-sell limits. We select companies trading at a 25-40% discount to its 2-year forward intrinsic value, coupled with catalysts for realizing their estimated upside potential.
Quantum Long Term Equity Value Fund has carved a niche for itself, by being able to predict certainty in equity outcomes to provide stability to your portfolio. With a remarkable 17-year track record of weathering market cycles, QLTEVF has acted as an anchor in a sea of uncertainty.
Choose certainty in an uncertain world with Quantum Long Term Equity Value Fund.
 |
 |
| Performance of the Scheme | Direct Plan | |||||||
| Quantum Long Term Equity Value Fund - Growth Option | ||||||||
| Current Value ₹10,000 Invested at the beginning of a given period | ||||||||
| Period | Scheme Returns (%) | Tier 1 - Benchmark# Returns (%) | Tier 2 - Benchmark## Returns (%) | Additional Benchmark Returns (%)## | Scheme (₹) | Tier 1 - Benchmark# Returns (₹) | Tier 2 - Benchmark## Returns (₹) | Additional Benchmark Returns (₹)## |
| Since Inception (13th Mar 2006) | 14.26% | 13.19% | 13.20% | 12.68% | 109,880 | 92,720 | 92,931 | 85,572 |
| February 28, 2014 to February 29, 2024 (10 years) | 14.90% | 16.70% | 16.36% | 14.59% | 40,161 | 46,890 | 45,554 | 39,067 |
| February 28, 2017 to February 29, 2024 (7 years) | 12.77% | 16.14% | 15.99% | 15.52% | 23,211 | 28,528 | 28,269 | 27,472 |
| February 28, 2019 to February 29, 2024 (5 years) | 15.61% | 18.98% | 18.40% | 16.48% | 20,666 | 23,865 | 23,294 | 21,463 |
| February 26, 2021 to February 29, 2024 (3 years) | 18.64% | 19.41% | 18.51% | 15.21% | 16,722 | 17,050 | 16,669 | 15,312 |
| February 28, 2023 to February 29, 2024 (1 year) | 39.32% | 39.34% | 37.17% | 24.51% | 13,944 | 13,947 | 13,729 | 12,458 |
Data as of Feb 29, 2024. #S&P BSE 500 TRI, ##S&P BSE 200 TRI, ###S&P BSE Sensex.
Past performance may or may not be sustained in the future.
Load is not taken into consideration in scheme returns calculation.
Different Plans shall have a different expense structure.
Returns are net of total expenses and are calculated on the basis of Compounded Annualized Growth Rate (CAGR).
#with effect from December 01, 2021 Tier I benchmark has been updated as S&P BSE 500 TRI. As TRI data is not available since inception of the scheme, benchmark performance is calculated using composite CAGR S&P BSE 500 index PRI Value from March 13, 2006 to July 31, 2006 and TRI Value since August 1, 2006.
##TRI data is not available since inception of the scheme, Tier II benchmark performance is calculated using composite CAGR S&P BSE 200 index PRI Value from March 13, 2006 to July 31, 2006 and TRI Value since August 1, 2006.
The Scheme is co-managed by Mr. George Thomas & Mr. Christy Mathai. Mr. George Thomas is the Fund Manager managing the scheme since April 1, 2022. Mr. Christy Mathai is the Fund Manager managing the scheme since November 23, 2022.
For other Schemes Managed by Mr. George Thomas & Mr. Christy Mathai, please Click here.
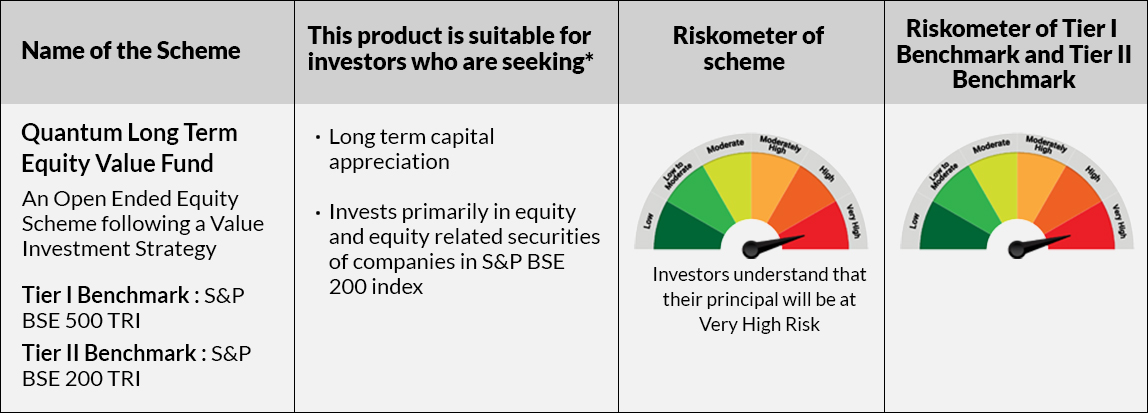
*Investors should consult their financial advisers if in doubt about whether the product is suitable for them.
For latest riskometer, investors may refer to the Monthly Portfolios disclosed on the website of the Fund www.QuantumAMC.com.
Disclaimer, Statutory Details & Risk Factors:The views expressed here in this article / video are for general information and reading purpose only and do not constitute any guidelines and recommendations on any course of action to be followed by the reader. Quantum AMC / Quantum Mutual Fund is not guaranteeing / offering / communicating any indicative yield on investments made in the scheme(s). The views are not meant to serve as a professional guide / investment advice / intended to be an offer or solicitation for the purchase or sale of any financial product or instrument or mutual fund units for the reader. The article has been prepared on the basis of publicly available information, internally developed data and other sources believed to be reliable. Whilst no action has been solicited based upon the information provided herein, due care has been taken to ensure that the facts are accurate and views given are fair and reasonable as on date. Readers of this article should rely on information/data arising out of their own investigations and advised to seek independent professional advice and arrive at an informed decision before making any investments. Mutual Fund investments are subject to market risks read all scheme related documents carefully. |
View All
Related Posts
-

Equity Outlook - July 2026
Posted On Wednesday, Jul 01, 2026
Indian equities recovered in the month of June, as the West Asia crisis showed signs of de-escalation.
Read More -

Equity Outlook - June 2026
Posted On Monday, Jun 01, 2026
Markets were marginally higher in the month of May. Following table shows the change in broad market cap indices.
Read More -

Equity Outlook - May 2026
Posted On Monday, May 04, 2026
Markets rebounded sharply from the lows of March after announcement of ceasefire. Following table shows the change in broad market cap indices.
Read More

