Debt Monthly for September 2025
Posted On Friday, Sep 05, 2025
Key highlights of the month: |
|
Chart I: Tracking India’s 10-Year Bond Yields Against Major Global Economies

Source: Bloomberg. Quantum AMC Graphics. Data up to August 29, 2025
August in the Indian bond market was nothing short of chaotic, with constant surprises and swings.
The month kicked off with U.S. President Trump’s tariff hike on India, which added pressure. The RBI's rate pause further fueled uncertainty, with markets fearing it to be the end of the rate cutting cycle.
Mid-month, S&P's credit rating upgrade briefly lifted sentiment, but optimism quickly faded after PM Modi’s GST 2.0 proposal raised concerns over revenue losses. As hopes for softer U.S. tariffs faded upon negotiations, the worst-case scenario hit when the higher tariffs went into effect. This added to market turbulence.
Despite a surprise 7.8% GDP growth in Q1FY26, inflation-adjusted growth was weaker than it appeared, and fiscal deficits soared due to weak tax collections and rising spending.
In the next section, we’ll dive deeper into these factors and our outlook for the rest of the year.
1) India’s Tariff Troubles

2) GST 2.0: Big Reform, Bigger Implications

Much will now depend on the GST Council meeting in early September. Two outcomes are likely:
- No net revenue loss if cess items transition cleanly and hikes elsewhere offset cuts.
- Some net revenue loss, requiring revenue-sharing negotiations between Centre and States.
Historically, this government has often underestimated tax revenues, with the final figures typically exceeding initial projections. Despite GST collections slowing to 9.4% YoY in FY25 (down from a 11% CAGR since FY19), this reform could reignite growth - especially with the expanding tax base (15.4mn taxpayers, up from 13mn in 2022).
That said, the actual benefit to consumers will depend largely on how much of the tax cut is passed on by producers.
3) S&P Upgrades India’s Sovereign Rating
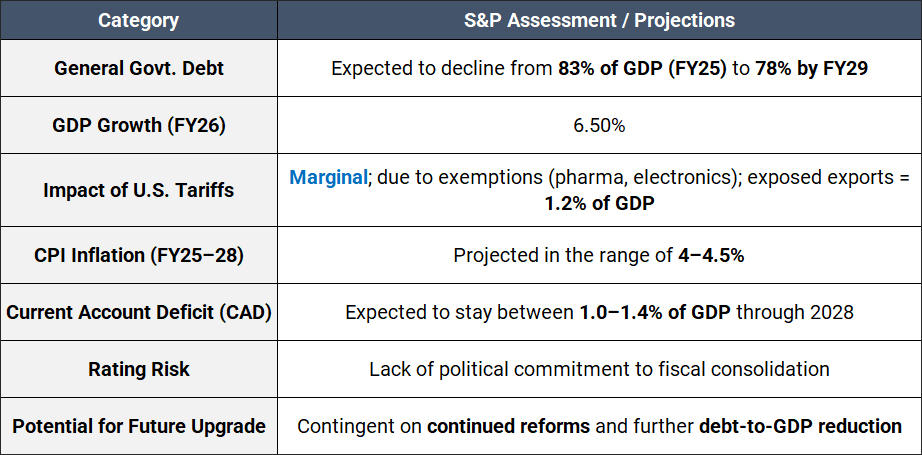
In August 2025, S&P Global Ratings upgraded India’s long-term sovereign credit rating to BBB from BBB–, with a stable outlook, marking the first upgrade in over a decade. The upgrade is underpinned by three key factors: Credible fiscal consolidation, A strong external position and Well-anchored inflation expectations.

This move by S&P is widely seen as long overdue, bringing India’s rating more in line with its robust macro fundamentals.
4) India’s Q1FY26 GDP growth - A positive surprise
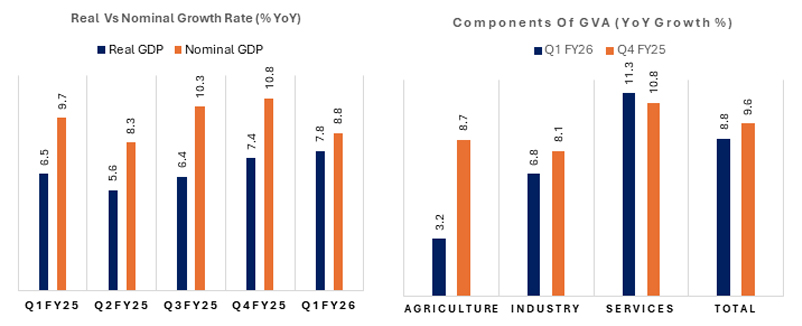
India’s Q1FY26 GDP growth surprised on the upside at 7.8% YoY, beating all estimates (vs. RBI’s 6.5%, consensus 6.7%). The outperformance was driven by strong private consumption and services sector growth, though nominal GDP slowed to 8.8%, reflecting a sharp drop in inflation (GDP deflator) which also supported real growth by boosting producer margins.
Chart II Front-loading of capex led GFCF to expand by 7.8% YoY. Private consumption remained steady on the back of rural demand and tepid urban consumption

Source: CMIE. Quantum AMC Graphics. Data for the quarter ended in June 2025.
Key Drivers for growth:
- Private consumption rose 7.0%, supported by rural demand, rising real wages, stronger FMCG sales, and lower National Rural Employment Guarantee Act, (NREGA) demand. However, urban demand remained weak, with soft vehicle sales and slow digital spending.
- Investment (Gross Fixed Capital Formation - GFCF) held firm at 7.8%, led by higher public capex.
- Services GVA (Gross Value Added) jumped to 9.3%, especially in trade, transport, and real estate, supported by rural activity and GST growth.
- Manufacturing grew 7.7%, helped by margin improvement from easing input costs.
- Government spending also boosted growth, with both Centre and State revenue expenditures rising sharply.
- Large “discrepancies” (1.8% contribution) suggest ongoing data gaps in expenditure metrics.
Despite strong real GDP, the slowdown in nominal growth, weak direct tax collections, and soft credit data suggest caution.
5) Headline CPI Eases, But Core Keeps the Pressure On
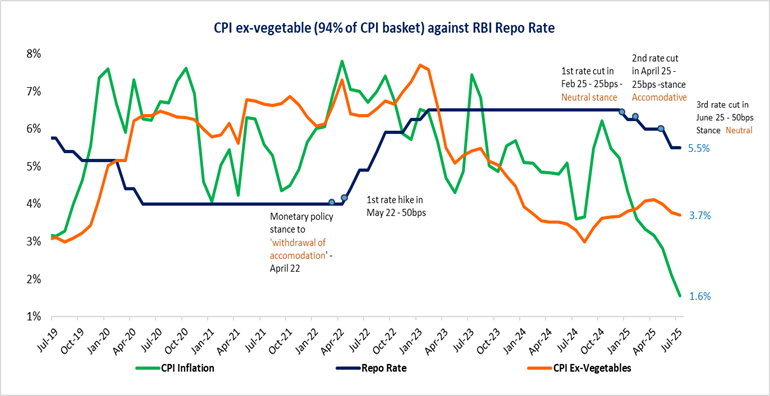
India’s headline CPI inflation cooled to 1.55% YoY in July, down from 2.1% in June (marking the lowest print in 8 years). The moderation was largely driven by falling food and beverage prices, with broad-based declines seen across vegetables, pulses, spices, and meat. Even cereals inflation continued to ease.
Core inflation also softened to 4.2% (from 4.5% in June), largely due to a dip in services inflation - particularly transportation, communication, education, and recreation. Some of the cooling was due to base effects (e.g. last year’s jump in mobile tariffs), while gold prices pushed up personal care inflation slightly. A closer look at core inflation (excluding gold, silver, and fuel) shows it remains low at 3.3%, suggesting continued weak demand conditions.
Chart III: CPI at Eight-Year Low: Food-Led Cooling Masks Sticky Core Pressures

Source: MOSPI, RBI. Quantum AMC Graphics. CPI data is for the month of July 2025, Repo Rates are as of July 30, 2025. Repo rate as of August 31, 2025 is unchanged at 5.5%.
The August CPI inflation is ~2.3%, on account of a less favorable base. However, daily food price trends show that vegetable inflation has eased month-on-month, owing to improved supplies. Pulses prices continue to decline, although edible oil prices remain sticky due to higher global rates. Core inflation is likely to come in above the 4% handle, mainly driven by gold.
Looking ahead, the outlook for food inflation is constructive:
- Kharif sowing is up 3.4% YoY and is nearly complete (as of August 22, 2025).
- Monsoon distribution has been favorable in key grain-producing states. Overall rainfall for the country as a whole has been 6% above the normal (as of August 31, 2025).
- Reservoir levels are above the 10-year average, which bodes well for the upcoming rabi crop.
All of this supports a subdued food inflation trend, and it's already showing — household inflation expectations have dropped to a 5-year low. However, above normal rain prediction for September, may be a risk to standing crops.
6) Indian Bond Yields Climb amid global market developments:
On the domestic front, Indian bond yields experienced an upward movement of ~20-30 bps across the curve. The RBI’s cautious pause, tariff announcements, rating upgrade by S&P, GST rejig igniting fiscal concerns, weaker demand in auctions, all led to bond yields climbing up.
Adding to the volatility, bond auctions saw weak demand, SDL (State Development Loans) borrowings increased, and supply concerns started to re-emerge - all signs that the stable demand-supply equation was starting to wobble.
On the global front, U.S. consumer spending surged in July, driven by stronger income growth despite high prices. Meanwhile, U.S. PCE (Personal Consumption Expenditures) inflation ticked up, signaling the impact of President Trump's tariffs on the economy. U.S. 10-year yields closed the month a little unchanged at 4.23% for the month of August 2025.
Chart IV: G-sec yield curve remains steep, but the yield curve has shifted upward with yields rising amid global market developments.

Source: Bloomberg. Quantum AMC Graphics. Above data is for the month ended August 2025, July 2025 (1 month ago), May 2025 (3 months ago) and Date of Tariff Announcement (April 2, 2025)
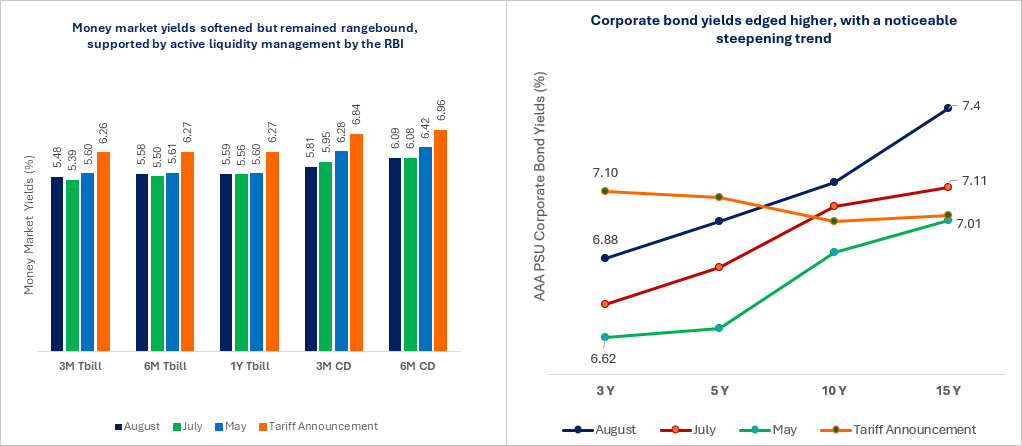
Money market yields in India remained rangebound on the back of liquidity support by the RBI. The RBI stepped in with measures to manage excess liquidity in the system, holding VRR and VRRR auctions. T-bill rates remained more or less steady compared to July 2025. The 3-month AAA PSU CP/CD rates too remained steady in the 5.80%- 6.1% range on a closing basis.
Chart V: Money Market Rates remained rangebound on the back of liquidity measures by the RBI; Corporate bond yields inched up across the curve broadly tracing the up move in G-sec yields

Source: Bloomberg. Quantum AMC Graphics. Above data is for the month ended August 2025, July 2025 (1 month ago), May 2025 (3 months ago) and Date of Tariff Announcement (April 2, 2025). Data on corporate bond yields is for AAA PSU corporate bonds.
The corporate bond yield curve has also moved up in line with the up move in the G-sec yields, with the spread narrowed slightly across the curve. By end-August 2025, the spread between 10-year corporate bonds and G-secs narrowed to nearly 60-75 bps, down from nearly 80 bps in the previous month. Demand for corporate bonds remains strong, supported by a steady supply pipeline.
7) RBI Prioritizes Transmission with Steady Liquidity Support
Liquidity conditions in India have tightened recently, mainly due to GST outflows, RBI’s FX interventions, and higher demand for cash (especially ahead of festivals). As a result, durable liquidity is back to around 2% of NDTL (Net Demand and Time Liabilities).
The RBI has been using Variable Rate Reverse Repo (VRRR) operations to stabilize liquidity. With rate cuts now largely off the table, funding stress has resurfaced (visible in the widening CD/OIS spreads).
While the CRR (Cash Reserve Ratio) cut could help ease liquidity and support cash demand during the festive season, it’s unlikely to revive deposit growth meaningfully. That’s a concern, as deposit growth may soon lag behind credit growth, especially with continued FX intervention and rising currency in circulation (CIC).
On a brighter note, non-food credit growth is showing signs of recovery - not just because of a low base, but also due to real improvement. Unsecured lending remains strong, and there are early signs of revival in industrial credit, particularly from MSMEs.
Chart VI: Banking system liquidity in surplus; Core liquidity too in a surplus ~ 5 trillion

Source: RBI. Quantum AMC Graphics. Data up to the week ended August 22, 2025.
8) The Hidden Cost of Defending the Rupee
While the rupee’s depreciation offers India some cushion against the impact of U.S. tariffs, it may revive a dilemma for the RBI - whether to intervene in the forex market to stabilize the currency or prioritize domestic liquidity and growth.
While intervening in forex markets helps stabilize the INR, it also drains rupee liquidity, tightening financial conditions. This has, in the past, coincided with slower deposit growth and reduced credit momentum. The RBI may again rely on quiet liquidity management, but this may still risk slowing credit expansion, especially when growth remains uneven.
If the likely pressure on the balance of payments returns, a large-scale intervention could unintentionally act as a brake on lending. Thus, defending the rupee may bring short-term currency stability, but it could also tighten liquidity and hinder credit growth at a delicate time for the economy.
Chart VII: INR Faces Continued Headwinds Amid Global Volatility

Source: Bloomberg. Quantum AMC Graphics. The above data is for the period starting the victory of Donald Trump in the US Presidential elections (06th November 2024) till 29th August 2025.
9) Foreign investments in IGBs (Indian Government Bond) saw significant growth in August 2025,
with the debt segment attracting $725 million during the month. However, this momentum faces risks amid rising global trade tensions under the Trump administration, increasing crude oil prices, and concerns about a potential pause in the RBI's rate-cut cycle, which have heightened caution and led to net outflows. Looking ahead, in the medium term, global financial markets are expected to see reduced volatility. The USD is likely to stabilize within its current range, which could trigger a reversal of the safe-haven trade, boosting capital flows into emerging markets like India.
Chart VIII: Amid Global Jitters, Indian Bonds saw inflows; August Marks a Modest Rebound

Source: CCIL, Bloomberg. Quantum AMC Graphics. Data up to the month ended August 2025.
Our View:
Despite the flurry of economic and geopolitical developments, we remain constructive on the Indian bond market. Several macro fundamentals continue to align in favour of a supportive rates environment: inflation is softening meaningfully, the fiscal slippage risk appears manageable, and rate cuts are likely back on the table before the end of FY26.
Headline CPI has fallen to multi-year lows, and while base effects could nudge year-on-year inflation higher ahead, we believe the underlying momentum remains benign. Food stocks are healthy, core inflation is subdued, and global oil prices remain in check (all of which support the case for further easing by the RBI).
On the fiscal front, though pressures are emerging from proposed GST reforms, weak tax collections, and higher spending needs, the downside appears contained. Our estimates suggest the probability of modest fiscal slippage which we believe could potentially be managed through short-term funding rather than aggressive bond issuance.
Externally, while trade tensions with the US pose risks, India’s balance of payments appear resilient. Even if the current account deficit (CAD) widens modestly, ample FX reserves provide a buffer, and import compression (alongside weak domestic demand) may help offset some of the export slowdown.
Meanwhile, foreign investors have shown growing interest in Indian debt, particularly as long-end yields rose, and the rate-cut narrative gained traction. With the global backdrop still uncertain, India's macro stability, deepening bond market, and real rate advantage makes Indian bonds relatively attractive.
That said, our near-term view is tempered by persistent uncertainties, most notably the upcoming GST Council deliberations in September. The tax reform has enormous potential to simplify structures and spur consumption, but its market impact will depend on how revenue sharing and producer pass-through play out. The fiscal math and inflation trajectory could look very different depending on the outcome.
The reform, coupled with monetary support and contained inflation, underpins our medium-term positive view on bonds, even if the near-term path remains volatile.
In line with this view, we have reduced the portfolio duration, and are exploring spread assets – SDLs and AAA Rated PSU bonds, to safeguard capital and better navigate a likely consolidation phase in bond markets.
What can investors do?
Given the current environment, bond yields are likely to either decline or remain range-bound. In such a volatile interest rate landscape, investors with a medium to long-term horizon may consider dynamic bond funds. These funds offer the flexibility to actively manage portfolio duration, allowing adjustments in response to evolving market conditions—making them well-suited for staying invested over longer periods.
For those with shorter investment horizons or a lower risk appetite, liquid funds continue to be a more appropriate choice, offering stability and easy access to funds.
Source: Reserve Bank of India (RBI), Ministry of Statistics & Program Implementation (MOSPI), Bloomberg
 |
Disclaimer, Statutory Details & Risk Factors:The views expressed here in this article / video are for general information and reading purpose only and do not constitute any guidelines and recommendations on any course of action to be followed by the reader. Quantum AMC / Quantum Mutual Fund is not guaranteeing / offering / communicating any indicative yield on investments made in the scheme(s). The views are not meant to serve as a professional guide / investment advice / intended to be an offer or solicitation for the purchase or sale of any financial product or instrument or mutual fund units for the reader. The article has been prepared on the basis of publicly available information, internally developed data and other sources believed to be reliable. Whilst no action has been solicited based upon the information provided herein, due care has been taken to ensure that the facts are accurate and views given are fair and reasonable as on date. Readers of this article should rely on information/data arising out of their own investigations and advised to seek independent professional advice and arrive at an informed decision before making any investments. Mutual Fund investments are subject to market risks, read all scheme related documents carefully. |
Related Posts
-

Debt Monthly for February 2026
Posted On Monday, Feb 02, 2026
In FYTD26, Indian bond yields defied expectations, firming up even as monetary policy turned supportive.
Read More -

Debt Monthly for January 2026
Posted On Thursday, Jan 01, 2026
Navigating 2026: India’s Bond Market in a Changing Global Landscape
Read More -

Debt Monthly for September 2025
Posted On Friday, Sep 05, 2025
August in the Indian bond market was nothing short of chaotic, with constant surprises and swings.
Read More


