The Third Investment Anchor Most Investors Ignore
Posted On Tuesday, Sep 30, 2025

Now shift the lens to investing.
You may not always know when the drop will come. But you can equip your portfolio with an approach that can reduce the impact—without stalling your upward journey.
That’s what risk coverage in mutual funds is all about. It’s not about playing it safe.
It’s about being smart enough to stay the course—
no matter what the terrain throws at your investments.
So, What Is This Risk We Keep Talking About?
When investors hear “risk,” they often think only of losses. But in investing, risk is better understood as variability. It’s the uncertainty in returns—how much the fund’s performance deviates from its average over time.
Think of it like a pendulum:
- A short swing (low standard deviation) means the fund returns hover close to its average.
- A wide swing (high standard deviation) means returns can swing higher—or lower—than its averages.
The image explains that investment risk refers to variability or uncertainty in returns. It compares risk to the movement of a pendulum. A short swing represents low variability, where returns stay close to the average, while a wide swing represents high variability, where returns can move higher or lower than the average. A Newton’s cradle pendulum illustration is used to visually demonstrate this concept
Standard Deviation (SD) quantifies this swing movement. It tells us:
How steady or erratic the journey has been.
Whether a fund is mostly stable or tends to veer sharply in bull and bear phases.
This movement is measured by Standard Deviation, a statistical number that tells us how variability of returns has been.
▎Every Fund Type Swings Differently—And That Matters to You
Let’s bring this to mutual funds.
Different funds come with different levels of SD — and therefore, different levels of risk. Here’s a quick map to understand where most mutual fund categories sit:
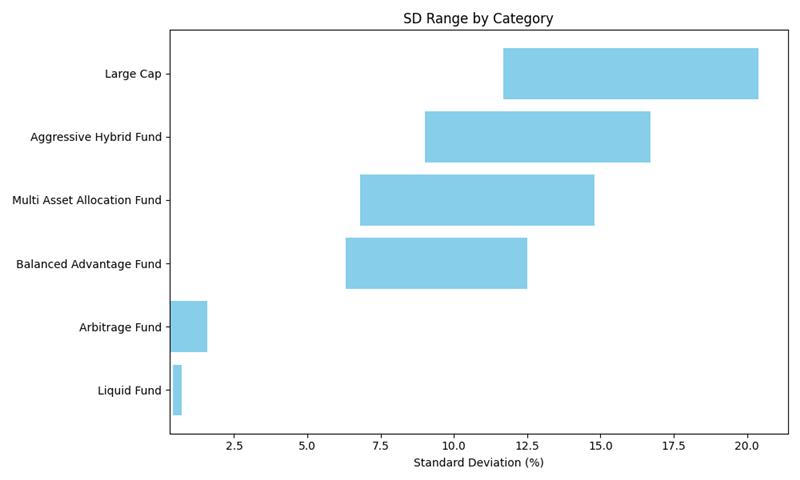
Source: ACE MF. Compiled by Quantum AMC. Standard deviation range is computed using 3-year rolling return of the respective categories. Time period for determining the range considered is from August 2020 to August 2025. Past performance may or may not be sustained in the future.
Understanding the SD band is essential. Because choosing a fund isn’t just about what it can earn — it’s also about how far it can fall in case of correction.
▎But What If Your Safety Net Isn’t So Safe?
Many investors hold both equity and debt in their portfolios — expecting debt to cushion the blow if equity markets fall. And generally, this mix has worked well across market cycles. But history shows that this isn’t always the case.
In certain periods, like the COVID-19 pandemic, equity and debt have dropped together, leaving portfolios exposed across the board.
So, when everything slips at once—where’s the safety net?
And that’s when you need low-correlation assets in the mix.
Assets that don’t move in the same direction. Especially during crisis phases, they offer a different rhythm—a true counterbalance when others sync up in a fall.
This Is Where Gold Quietly Does Its Job
Gold has a distinct role in a portfolio. It doesn’t follow equity. It doesn’t track debt. In fact, it often rises when others fall — particularly during periods of inflation, global uncertainty, or geopolitical risk.
This isn’t about gold being a high‑return asset. It’s about gold being a counterweight — a buffer when your other investments lose value. This is what makes gold a natural safeguard in a long‑term portfolio.
The image explains the role of gold in an investment portfolio. It shows that gold behaves differently from equity and debt investments and may perform well during periods of inflation, global uncertainty, or geopolitical risk. Gold is described as a counterbalance that helps protect a portfolio when other investments lose value. An illustration of stacked gold coins with a plant growing on top represents stability, diversification, and long-term financial growth.
▎Two Paths, One Goal: Managing Market Exposure
Let’s look at two categories that aim to balance return potential and risk: Hybrid / Balanced Fund category with variants and Multi Asset Allocation Funds (MAAFs).
▶ Hybrid / Balanced Fund category with variants moves between equity and debt, trying to time the market using in-house models. If their model is strong, it can reduce downside during volatile phases. It’s a two-legged strategy—limited to debt and equity. And their performance depends on the accuracy of market timing and allocation.
▶ MAAFs, on the other hand, use a broader 3-asset framework equity, debt, and gold. This gives them an additional layer of diversification—especially valuable in times when neither equity nor debt is doing well. Gold, historically, has shown resilience during uncertain periods—adding a natural diversification to the portfolio.
The result?
MAAFs tend to carry a more measured risk profile and provide better diversification, which means more risk control through diversification.
This image shows a data table presenting key investment figures and metrics relevant to the article, such as returns, performance percentages, and comparisons across schemes or time periods. The table provides a quick reference for readers to understand quantitative aspects of financial planning.
Why QMAAF May Be Better Anchored?
At Quantum, our Multi Asset Allocation Fund (QMAAF) follows a dynamic allocation strategy. It’s designed to keep your investments invested— without constantly reacting to market noise.
| Risk Return (2005–2025) | Equity (40%) + Debt (40%) + Gold (20%) | *Equity (60%) + Debt (40%) | Equity (100%) | Debt (100%) | Gold (100%) |
|---|---|---|---|---|---|
| Avg. Annualized Returns | 10.73% | 10.02% | 11.20% | 6.98% | 13.52% |
| Annualized Standard Deviation | 8.84% | 12.64% | 20.64% | 3.14% | 16.85% |
| Maximum Drawdown | ‑21.4% | ‑36.1% | ‑56.2% | ‑6.3% | ‑25.2% |
Disclaimer: Time frame is September 2005 to August 2025. We have considered monthly data for all asset classes for a period of 20 years. The above factual data analysis is simply for understanding the concept of multi‑asset allocation. Compiled by Quantum AMC.
*Equity‑Debt‑Gold in ratio of 40‑40‑20. **Equity‑Debt allocated in 60‑40 range. Based on Sensex Index, CRISIL Composite Bond Fund Index, and Domestic Gold Prices. Past performance may or may not be sustained in the future.
Here’s what sets it apart:
- Disciplined allocation across equity, debt, and gold
- No aggressive market timing calls
- Risk spread across asset classes, not concentrated in a single asset class
- A long‑term approach to wealth‑building, with an aim to protect downside
The focus: To keep the fund’s standard deviation in a lower band while still aiming for risk‑adjusted returns with a smoother investing experience.
Along with Equity & Debt, QMAAF brings a third layer of resilience—with gold working like that extra piton on the mountain face.
"The chart explains why QMAAF (Quantum Multi Asset Allocation Fund) may provide a more balanced investment approach. It compares different asset allocations including: Equity 40%, Debt 40%, Gold 20; Equity 60% and Debt 40; 100% Equity; 100% Debt; and 100% Gold. Average annualized returns range between 6.98% and 13.52%. The diversified 40-40-20 allocation shows returns of about 10.73%. Standard deviation, which measures volatility, is significantly lower for diversified portfolios compared to pure equity investments. Maximum drawdown shows risk during market downturns. Diversified allocation recorded around negative 21.4% while pure equity saw drawdowns above negative 56%. The fund focuses on disciplined allocation across equity, debt, and gold, avoiding aggressive market timing and spreading risk across asset classes to support long-term wealth creation and downside protection."
Multi-asset allocation isn’t new to us. We’ve run this philosophy through Quantum Multi Asset Active FOF since 11th July, 2012, and, through Quantum Multi Asset Allocation Fund since 7th March, 2024.
This doesn’t mean the climb won’t be tough.
But it does mean you’re better equipped for the journey.
Know what you’re anchored to. And make your next step count.
This doesn’t mean the climb won’t be tough. But it does mean you’re better equipped for the journey. Know what you’re anchored to. And make your next step count.
Mr. Chirag Mehta is the Fund Manager effective from March 07, 2024.
Ms. Sneha Pandey is the Fund Manager managing the scheme since April 01, 2025.
Ms. Mansi Vasa is the Associate Fund Manager managing the scheme since April 01, 2025.
| Quantum Multi Asset Allocation Fund - Direct Plan - Growth Option | Current Value ₹10,000 Invested at the beginning of a given period | |||||
|---|---|---|---|---|---|---|
| Period | Scheme Returns (%) | Tier I - Benchmark# Returns (%) | Additional Benchmark Returns (%)## | Scheme Returns (₹) | Tier I - Benchmark# Returns (₹) | Additional Benchmark Returns (₹)## |
| Since Inception (07th Mar 2024) | 11.07% | 11.88% | 6.61% | 11,680 | 11,807 | 10,994 |
| 1 year | 6.49% | 8.71% | -1.95% | 10,647 | 10,868 | 9,805 |
#NIFTY 50 TRI (40%) + CRISIL Short Duration Debt A-II Index (45%) + Domestic Price of Gold (15%); ##BSE Sensex TRI. Past performance may or may not be sustained in the future. Load is not taken into consideration in scheme returns calculation. Different Plans shall have a different expense structure. Returns are net of total expenses and are calculated on the basis of Compounded Annualized Growth Rate (CAGR). Performance details of other funds managed by Mr. Chirag Mehta, Mrs. Sneha Pandey & Mrs. Mansi Vasa. Click here
Mr. Chirag Mehta is the Fund Manager managing the scheme since July 11, 2012.
Ms. Sneha Pandey is the Fund Manager managing the scheme since April 01, 2025.
Ms. Mansi Vasa is the Associate Fund Manager managing the scheme since April 01, 2025.
| Quantum Multi Asset Active FOF - Direct Plan - Growth Option | Current Value ₹10,000 Invested at the beginning of a given period | |||||
|---|---|---|---|---|---|---|
| Period | Scheme Returns (%) | Tier I - Benchmark# Returns (%) | Additional Benchmark Returns (%)## | Scheme Returns (₹) | Tier I - Benchmark# Returns (₹) | Additional Benchmark Returns (₹)## |
| Since Inception (11th Jul 2012) | 9.93% | 10.71% | 13.73% | 34,706 | 38,077 | 54,246 |
| 1 year | 7.74% | 8.06% | -1.95% | 10,771 | 10,804 | 9,805 |
| 3 years | 12.29% | 12.20% | 11.65% | 14,157 | 14,124 | 13,917 |
| 5 years | 11.11% | 12.14% | 17.05% | 16,931 | 17,732 | 21,958 |
| 7 years | 10.05% | 11.28% | 12.27% | 19,553 | 21,133 | 22,479 |
| 10 years | 9.87% | 10.91% | 13.14% | 25,645 | 28,170 | 34,393 |
Past performance may or may not be sustained in the future. Load is not taken into consideration in scheme returns calculation. Different Plans shall have a different expense structure. Returns are net of total expenses and are calculated on the basis of Compounded Annualized Growth Rate (CAGR). #CRISIL Dynamic Bond A-III Index (20%) + CRISIL Liquid Debt A-I Index (25%) + Nifty 50 TRI (40%) + Domestic price of Gold (15%). It is a customized index and it is rebalanced daily. ##BSE Sensex TRI. **The name of Quantum Multi Asset Fund of Funds has been changed to Quantum Multi Asset Active FOF effective from August 29, 2025. Performance details of other funds managed by Mr. Chirag Mehta, Mrs. Sneha Pandey & Mrs. Mansi Vasa. Click here
Product Labeling
| Name of the Scheme | This product is suitable for investors who are seeking* | Riskometer of scheme | Risk-o-meter of Tier-I Benchmark |
|---|---|---|---|
Quantum Multi Asset Allocation Fund An Open-Ended Scheme Investing in Equity & Equity Related Instruments, Debt & Money Market Instruments and Gold Related Instruments Tier I Benchmark: NIFTY 50 TRI (40%) + CRISIL Short Term Bond Fund All Index (45%) + Domestic Price of Gold (15%) |
| 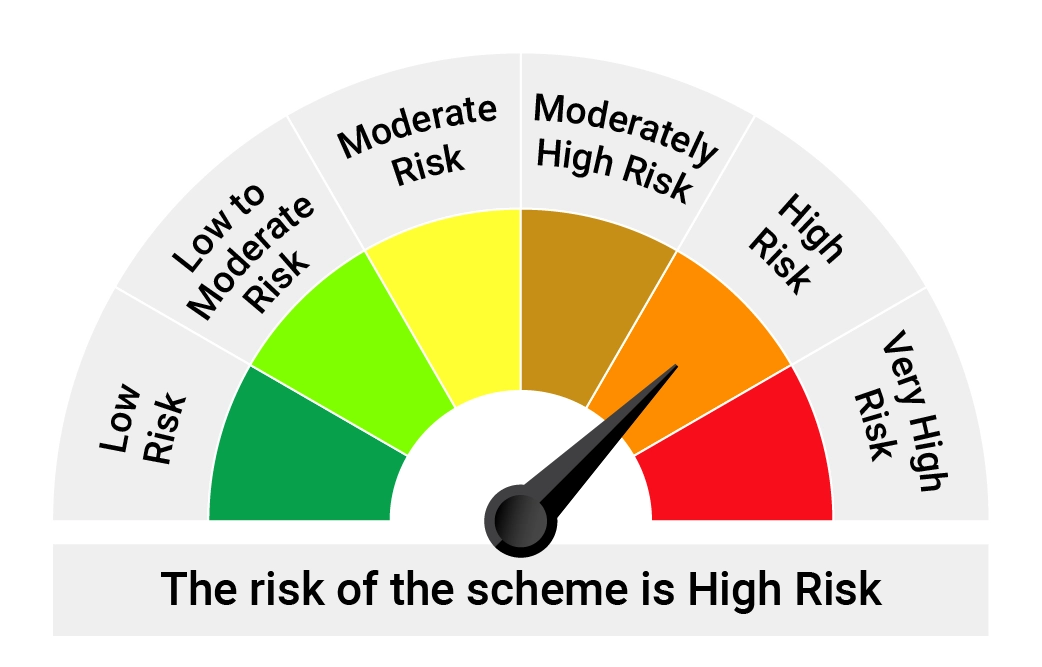 | 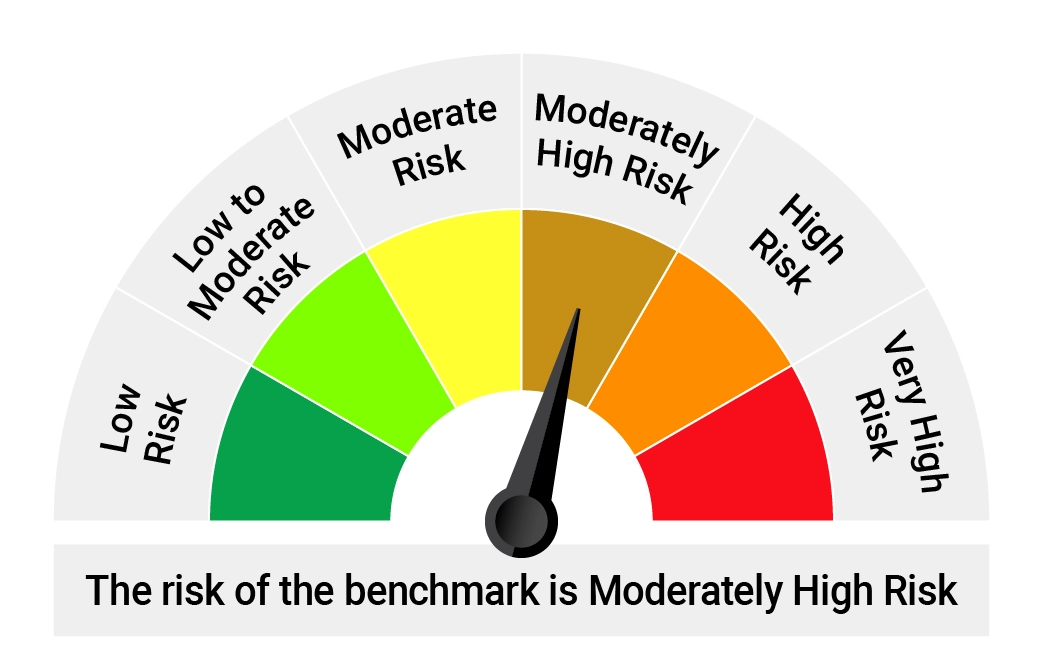 |
*Investors should consult their financial advisers if in doubt about whether the product is suitable for them.
| Name of the Scheme | This product is suitable for investors who are seeking* | Riskometer of scheme | Risk-o-meter of Tier-I Benchmark |
|---|---|---|---|
Quantum Multi Asset Active FOF An Open-Ended Fund of Funds scheme investing in Equity-oriented schemes, Debt oriented schemes and Gold based schemes Tier I Benchmark : CRISIL Dynamic Bond A-III Index (20%) + CRISIL Liquid Debt A-I Index (25%) + Nifty 50 TRI (40%) + Domestic price of Gold (15%) |
| | |
*Investors should consult their financial advisers if in doubt about whether the product is suitable for them.
Investors may please note that they will be bearing the recurring expenses of this Scheme in addition to the expenses of the Underlying Schemes.
Disclaimer, Statutory Details & Risk Factors:
The views expressed here in this article / video are for general information and reading purpose only and do not constitute any guidelines and recommendations on any course of action to be followed by the reader. Quantum AMC / Quantum Mutual Fund is not guaranteeing / offering / communicating any indicative yield on investments made in the scheme(s). The views are not meant to serve as a professional guide / investment advice / intended to be an offer or solicitation for the purchase or sale of any financial product or instrument or mutual fund units for the reader. The article has been prepared on the basis of publicly available information, internally developed data and other sources believed to be reliable. Whilst no action has been solicited based upon the information provided herein, due care has been taken to ensure that the facts are accurate and views given are fair and reasonable as on date. Readers of this article should rely on information/data arising out of their own investigations and advised to seek independent professional advice and arrive at an informed decision before making any investments.
Mutual fund investments are subject to market risks read all scheme related documents carefully.
View All
Related Posts
-

Equity Outlook - July 2026
Posted On Wednesday, Jul 01, 2026
Indian equities recovered in the month of June, as the West Asia crisis showed signs of de-escalation.
Read More -

Equity Outlook - June 2026
Posted On Monday, Jun 01, 2026
Markets were marginally higher in the month of May. Following table shows the change in broad market cap indices.
Read More -

Equity Outlook - May 2026
Posted On Monday, May 04, 2026
Markets rebounded sharply from the lows of March after announcement of ceasefire. Following table shows the change in broad market cap indices.
Read More

