Quantum Dynamic Bond Fund Turns 10: Reflecting with Pride, Advancing with Purpose
Posted On Thursday, May 22, 2025

Did you know today’s small-cap threshold of ₹30,000 crs is where HDFC Bank stood back in 2006? Fast forward to 2025, and it now towers at over ₹11 lakh crs - a symbol of India’s financial strength.
This isn’t a one-off story.
India’s 251st listed company now holds a market cap of ~₹30,000 crs – a far cry from what was considered "large" not too long ago.
Clearly, small is no longer just small—it’s where tomorrow’s leaders emerge.
And this trend is accelerating.
Small is Scaling Faster Than Ever
In 2025, India’s 251st listed stock has a market cap of ~₹30,000 crs—a level considered large cap not too long ago. The small cap universe is growing, maturing, and evolving with India’s economy.
This remarkable shift signals more than just market growth; it reflects how the small cap universe is expanding and unlocking new potential.
And they aren’t just growing in size—they’re growing in profitability as well.
| Index | Mar-18 | Mar-25 | Growth % | |||||||
|---|---|---|---|---|---|---|---|---|---|---|
| Market Cap (Cr) | % Contribution | PAT (Cr) | % Contribution | Market Cap (Cr) | % Contribution | PAT (Cr) | % Contribution | Market Cap | PAT | |
| BSE 100 | 1,33,84,487 | 75% | 3,94,665 | 77% | 2,78,84,347 | 68% | 11,29,860 | 75% | 108% | 186% |
| BSE Midcap 150 | 28,75,144 | 16% | 79,753 | 16% | 87,12,558 | 21% | 2,52,233 | 17% | 203% | 216% |
| BSE Small Cap 250 | 15,42,068 | 9% | 35,530 | 6% | 45,35,495 | 11% | 1,16,361 | 8% | 194% | 228% |
| Total | 1,78,01,699 | 5,09,948 | 4,11,32,400 | 100% | 14,98,453 | 100% | ||||
| Source: Bloomberg, Ace Equity, Data as on FY25. | ||||||||||
The message is clear: India’s next wave of wealth creators is emerging from the small cap space.
Opportunities Galore—But Quality and Valuation Matter More Than Ever
India’s small cap segment is brimming with potential, but amid this opportunity-rich environment, it’s critical not to lose sight of valuation discipline and governance quality.
Valuations have expanded across the board, and not all growth stories are backed by fundamentals or are priced to perfection leaving little to no visible upside for investors. Chasing momentum without evaluating the price you’re paying can erode long-term returns.
Promoter intent and governance standards are equally vital. A fast-growing company with poor transparency or misaligned incentives can quickly turn from promising to problematic.
That’s Why a Disciplined Approach Wins
At Quantum Small Cap Fund, we don’t just look for growth—we look for:
| Particulars | Quantum Small Cap Fund | BSE 250 SmallCap Index |
|---|---|---|
| P/E (TTM) | 25.1 | 32.2 |
| P/E (1 Yr Forward) | 20.1 | 27.3 |
| EPS Growth (%) | 24.1% | 18.3% |
| P/B (x) | 2.9 | 3.8 |
| Dividend yield (%) | 0.9% | 0.75% |
| PEG (x) | 0.80 | 1.48 |
The figures mentioned above for EPS Growth (%) are calculated on the basis of Bloomberg consensus estimates.
Source: Bloomberg, Compiled by Quantum. Data as on June 30, 2025.
The Bottom Line
In a space where exuberance can often mask excesses, a measured, fundamentals-driven, and governance-aware approach is your best ally.
The next set of small cap stocks are already out there—emerging, building, scaling.
Don’t miss out on the early innings.
| Quantum Small Cap Fund - Direct Plan - Growth Option | Current Value ₹10,000 Invested at the beginning of a given period | |||||
|---|---|---|---|---|---|---|
| Period | Scheme Returns (%) | Tier I - Benchmark# Returns (%) | Additional Benchmark Returns (%)## | Scheme Returns (₹) | Tier I - Benchmark# Returns (₹) | Additional Benchmark Returns (₹)## |
| Since Inception (November 03, 2023) | 17.69% | 24.40% | 18.49% | 13,100 | 14,361 | 13,247 |
| 1 year | 10.86% | 3.44% | 7.00% | 11,092 | 10,346 | 10,704 |
#BSE 250 SmallCap TRI; ## BSE Sensex TRI. Past performance may or may not be sustained in the future. Load is not taken into consideration in scheme returns calculation. Different Plans shall have a different expense structure. Returns are net of total expenses and are calculated on the basis of Compounded Annualized Growth Rate (CAGR). Performance details of other funds managed by Mr. Chirag Mehta & Mrs. Abhilasha Satale. Click here
Product Labeling
| Name of the Scheme | This product is suitable for investors who are seeking* | Riskometer of scheme | Risk-o-meter of Tier-I Benchmark |
|---|---|---|---|
Quantum Small Cap Fund An Open Ended-Equity Scheme Predominantly Investing in Small Cap Stocks Tier I Benchmark: BSE 250 SmallCap TRI |
|  | 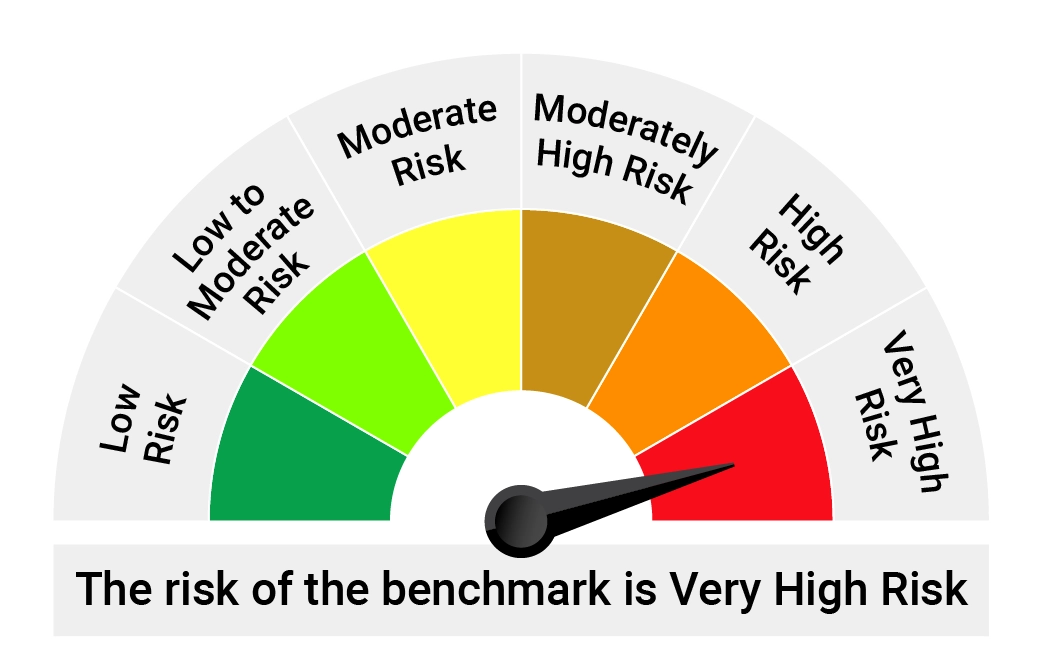 |
*Investors should consult their financial advisers if in doubt about whether the product is suitable for them.
Disclaimer, Statutory Details & Risk Factors:
The views expressed here in this article / video are for general information and reading purpose only and do not constitute any guidelines and recommendations on any course of action to be followed by the reader. Quantum AMC / Quantum Mutual Fund is not guaranteeing / offering / communicating any indicative yield on investments made in the scheme(s). The views are not meant to serve as a professional guide / investment advice / intended to be an offer or solicitation for the purchase or sale of any financial product or instrument or mutual fund units for the reader. The article has been prepared on the basis of publicly available information, internally developed data and other sources believed to be reliable. Whilst no action has been solicited based upon the information provided herein, due care has been taken to ensure that the facts are accurate and views given are fair and reasonable as on date. Readers of this article should rely on information/data arising out of their own investigations and advised to seek independent professional advice and arrive at an informed decision before making any investments.
Mutual fund investments are subject to market risks read all scheme related documents carefully.
View All
Related Posts
-

What Does the West Asia Crisis Mean for India’s Economy?
Posted On Tuesday, Mar 24, 2026
Over the past few years, geopolitics has steadily returned to the center of global economic discussions.
Read More -

Looking Beyond the 10-Year Benchmark: Decoding India’s Bond Market Signals
Posted On Thursday, Feb 26, 2026
If you glance at India’s financial headlines today, the tone feels reassuring.
Read More -

Positioning for Disinflation
Posted On Friday, Jan 27, 2023
We are well past the peak inflation of 2022. Yet, inflation continues to be the focal point of all the policy discussions and investment thesis in 2023.
Read More

