page
Updated on 30/04/2026
All investing involves an element of risk. In a mutual fund investors trust their money to the fund manager whose team in turn invests it in securities linked to the financial market - equities, debt, and gold depending on the fund’s nature. And the market values of these keep moving which makes the returns from mutual funds subject to risk.
heading
Risk overview
The risk in mutual funds investment mainly refers to the possibility of returns being different from what was originally expected. In other words risk indicates volatility of returns. Generally higher the return higher would be the risk associated with the investment. This relationship of risk and return is central to investing, which all investors should be aware of.
Fundamentally it works this way because investors who take on higher risk need to be compensated with higher returns. Thus although ‘risk’ commonly rings a negative connotation for investors, who believe it is to be avoided as much as possible, it is not necessarily an evil. By understanding and managing it investors can use it to their advantage in meeting their investment goals.
Understanding your risk appetite to choose investments
To be able to choose the right funds an investor needs to be aware of his/her risk appetite. Risk appetite refers to the ability and willingness of a person to tolerate loss of their investment. Individual risk tolerance is a very subjective matter and depends on one’s financial situation as well as psychological characteristics.
An aggressive investor is prepared to take higher risk in anticipation of higher returns whereas a conservative investor would be content with low returns in return of lower risk. Therefore the products a person aged 50 years uses for building retirement corpus may be very different from what a person aged 35 years may choose for the same goal.
Generally speaking, amongst the securities that mutual funds’ portfolio are built of, the spectrum of risk would have cash and money market securities having the lowest risk at the left end, bonds and other debt securities in the middle and gold, equities at the right having the highest risk.
securities & FDs
debt securities
Aligning investments with your risk appetite is important for success. For an assessment of your risk profile and suggested investment portfolio kindly visit the Asset Allocation calculator.
Measures of risk in mutual funds
It’s important to understand the level of risk linked to an investment product while planning to employ it. Two funds giving similar returns may not be equally attractive as one can be significantly risky than the other. For you to be able to choose funds suiting your risk profile we have classified schemes of Quantum Mutual Fund based on their riskiness below. However first we present the basic risk measures commonly used to evaluate mutual funds - alpha, beta, r-squared and standard deviation.
Beta
Beta measures a fund’s volatility in comparison with the market. The volatility of the market is 1 by convention. For mutual funds their benchmark is taken to be the market.
A beta greater than 1 says the fund is more volatile than the market whereas beta less than 1 indicates it is less volatile than the market. For instance if a fund has beta 1.1 then it is 10% more volatile than its benchmark. This means when the benchmark’s return is 20% the fund’s return would be 22%.
Higher beta thus means higher risk. Conservative investors would seek funds with low beta levels.
Alpha
Alpha measures a fund’s outperformance with respect to its benchmark. Technically it indicates a fund’s performance as measured by the difference in actual returns and the returns one would have expected based on its beta risk. So a positive alpha indicates a fund’s outperformance compared to what was expected based on its beta and a negative alpha tells a fund has underperformed than what its beta predicted.
In essence alpha represents the value a fund manager adds to the fund by managing its portfolio, over and above the market’s returns. Alpha returns come from the fund manager’s ability to pick the right securities and also time the entry and exit in those securities well.
Higher the alpha the better it is for investors. However for index funds, whose portfolios are supposed to be replicas of their benchmarks, alpha is not a relevant risk tool.
R-squared
R-squared tells how similar a fund’s performance is to its benchmark’s; or put differently how much of the performance comes solely from movements in its benchmark. R-squared values range from 0 to 1 and are commonly stated as percentages from 0 to 100%. An R-squared of 100% means all movements of a security are completely explained by movements in the index.
Actively managed funds would be expected to have low R2 since their portfolio would not be identical to their benchmark index and hence their performance would be quite different from the benchmark’s.
To correctly measure a fund’s risk-return in terms of alpha, beta it is important that the selected benchmark has high R2.
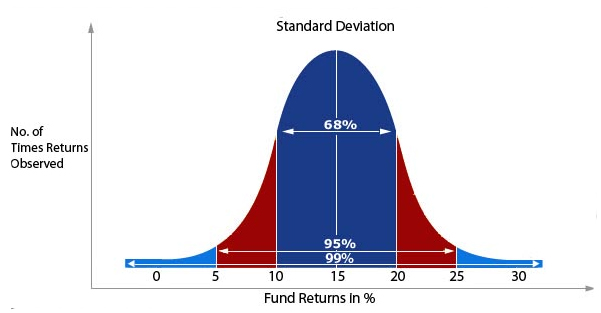
Standard deviation (SD)
This measure is used perhaps more than others in gauging a fund’s risk. Standard deviation of a fund, expressed as a percentage, defines how much a fund’s return has varied from its average return. If a fund has higher standard deviation its returns (as calculated from NAV) is expected to be so much more volatile. In short standard deviation of a fund represents the consistency of its performance.
Getting a little deeper into the properties of standard deviation, in most cases the fund’s future returns would fall within one SD 68% of the time, within two SDs 95% and within three SDs 99% of the time. What this means is if a fund has standard deviation of 5 and its average annual return has been 15% then one can expect its returns to lie between 10% and 20% most of the time (or to be accurate 68% of the time) and can expect them to be between 5% and 25% almost all of the time (95% of the time).
Standard deviation of a fund should be studied in comparison with its peer funds - funds of a category having similar portfolio construction.
Risk levels of Quantum’s funds
Here is a graphical comparison of Quantum’s schemes based on the high risk-high return, low risk-low return principle.
Illustrative view
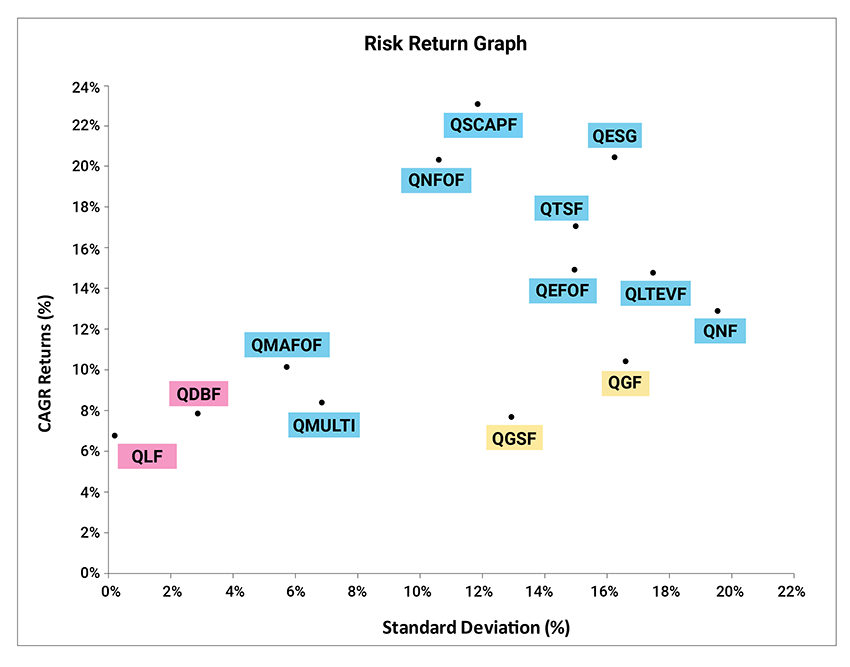
Disclaimer: The above chart is for illustration purpose only
The various BSE and NSE Indices are compiled on factors such as market cap, trading volume, and a broad sector representation. In doing so, the quality of the management - while admittedly a qualitative judgement - is not considered. This, in our view, represents "risk". For the increased "risk" taken, financial theory suggests that investors should get higher returns. By adding an integrity screen to our investment process, the Quantum Value Fund (QVF) and the Quantum Tax Saving Fund (QTSF) are attempting to reduce such "risks" - and therefore might generate lower returns. To peruse the performance of our schemes please see below. Past Performance may or may not be sustained in the future.
Quantum Liquid Fund which invests primarily in money market securities is expected to be in the low risk category among all funds. Quantum Dynamic Bond Fund invests in debt securities and therefore follows the liquid fund on this chart. Following it are Quantum Gold Savings Fund whose portfolio is mostly composed of units of Quantum Gold Fund (ETF) along with a small exposure to liquid securities, and Quantum Gold Fund (ETF) investing in gold bullion.
Quantum Multi Asset Fund of Funds comes next; its portfolio has exposure to equities, debt and gold.
Farther along the risk chart are the equity funds. Quantum Tax Saving Fund and Quantum Value Fund are expected to have greater risk than the non-equity funds. Quantum Equity Fund of Funds which invests in a basket of select equity mutual funds features next. Quantum Nifty 50 ETF (QNifty) at the farthest is expected to be in the high risk category among all funds as it replicates the index Nifty 50 in composition and has no active management by fund managers.
In reality however the riskiness of funds - as known from their actual performance studied over periods - may vary from the illustrative chart based on various factors that affect performance such as state of the national economy, climate in global financial markets, exchange rate scenario, etc.
Performance and NAV chart of Quantum Value Fund (QVF)
Mr. George Thomas is the Fund Manager managing the scheme since April 1, 2022.
Mr. Christy Mathai is the Fund Manager managing the scheme since November 23, 2022.
Please note that name of “Quantum Long Term Equity Value Fund“ scheme has changed to “Quantum Value Fund” effective May 01, 2025.
The following scheme returns (%) shown is as per Direct Plan - Growth Option.
| Value of investment of Rs. 10,000@ | Quantum Value Fund - Direct Plan - Growth Option | |||||||
|---|---|---|---|---|---|---|---|---|
| Period | Scheme Returns (%) | Tier I - Benchmark # Returns (%) | Tier II - Benchmark ## Returns (%) | Additional Benchmark Returns (%) ### | Scheme (Rs.) | Tier I - Benchmark # Returns (Rs.) | Tier II - Benchmark ## Returns (Rs.) | Additional Benchmark Returns (Rs.) ### |
| Since Inception * | 13.30% | 12.43% | 12.44% | 11.70% | 1,23,670 | 1,05,962 | 1,06,123 | 92,953 |
| 10 years | 12.09% | 14.43% | 14.24% | 12.97% | 31,349 | 38,553 | 37,916 | 33,903 |
| 7 years | 12.02% | 14.16% | 13.75% | 11.48% | 22,143 | 25,292 | 24,665 | 21,406 |
| 5 years | 13.02% | 13.87% | 13.40% | 10.84% | 18,450 | 19,150 | 18,762 | 16,734 |
| 3 years | 15.20% | 14.90% | 14.26% | 9.26% | 15,306 | 15,186 | 14,935 | 13,052 |
| 1 year | -2.30% | 3.64% | 2.51% | -3.05% | 9,770 | 10,364 | 10,251 | 9,695 |
# BSE 500 TRI ## BSE 200 TRI ### BSE Sensex TRI.
*Inception Date - March 13, 2006
Data as on April 30th 2026. Past performance may or may not be sustained in the future. Load is not taken into consideration in scheme returns calculation.
Different Plans shall have a different expense structure. Returns are net of total expenses and are calculated on the basis of Compounded Annualized Growth Rate (CAGR). #with effect from December 01, 2021, Tier I benchmark has been updated as BSE 500 TRI. As TRI data is not available since inception of the scheme, benchmark performance is calculated using composite CAGR BSE 500 index PRI Value from March 13, 2006 to July 31, 2006 and TRI Value since August 1, 2006. ##TRI data is not available since inception of the scheme, Tier II benchmark performance is calculated using composite CAGR BSE 200 index PRI Value from March 13, 2006 to July 31, 2006 and TRI Value since August 1, 2006.
The Scheme is co-managed by George Thomas and Christy Mathai. Click here for performance details of other funds managed by them.
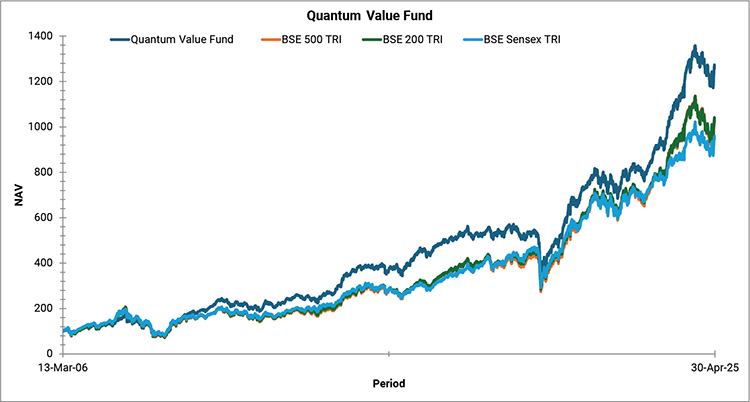
Past Performance may or may not be sustained in the future
Note: NAV & Benchmark data considered for above graph as on April 30th 2026.
Performance and NAV chart of Quantum Liquid Fund (QLF)
Ms. Sneha Pandey is the Fund Manager effective from April 01, 2025.
Mr. Mayur Chauhan is the Fund Manager effective from July 01, 2025.
The following scheme returns (%) shown is as per Direct Plan - Growth Option.
| Value of investment of Rs. 10,000@ | Quantum Liquid Fund - Direct Plan - Growth Option | |||||
|---|---|---|---|---|---|---|
| Period | Scheme Returns (%) | Tier I - Benchmark # Returns (%) | Tier II - Benchmark ## Returns (%) | Scheme (Rs.) | Tier I - Benchmark # Returns (Rs.) | Tier II - Benchmark ## Returns (Rs.) |
| Since Inception * | 6.72% | 6.80% | 6.15% | 36,918 | 37,437 | 33,144 |
| 10 years** | 5.67% | 6.06% | 6.03% | 17,366 | 18,012 | 17,968 |
| 7 years** | 5.36% | 5.68% | 5.75% | 14,412 | 14,724 | 14,791 |
| 5 years** | 5.79% | 6.04% | 5.63% | 13,253 | 13,412 | 13,154 |
| 3 years** | 6.63% | 6.86% | 6.51% | 12,126 | 12,205 | 12,085 |
| 1 year** | 5.84% | 6.10% | 4.62% | 10,584 | 10,610 | 10,462 |
| 1 month* | 6.44% | 7.32% | 3.90% | 10,053 | 10,060 | 10,032 |
| 15 days* | 4.56% | 4.71% | 1.79% | 10,019 | 10,019 | 10,007 |
| 7 days* | 4.24% | 4.30% | -0.12% | 10,008 | 10,008 | 10,000 |
# CRISIL Liquid Fund AI Index ## Crisil 1 year T-bill Index
*Inception Date - April 07, 2006
Data as on April 30th 2026. Past performance may or may not be sustained in the future.
@ indicates current value of Rs. 10,000/- invested at the beginning of a given period.
Different Plans have a different expense structure.
* Simple Annualized
** Returns for 1 year and above period are calculated on the basis of Compounded Annualized Growth Rate (CAGR).
Returns are net of total expenses.
Ms. Sneha Pandey manages 4 schemes and Mr. Mayur Chauhan manages 2 schemes of the Quantum Mutual Fund. Click here for performance details of other funds managed by him.
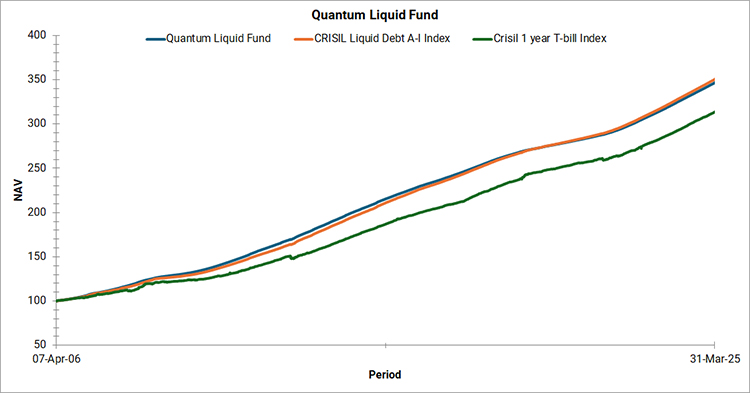
Past Performance may or may not be sustained in the future
Note: NAV & Benchmark data considered for above graph as on April 30th 2026
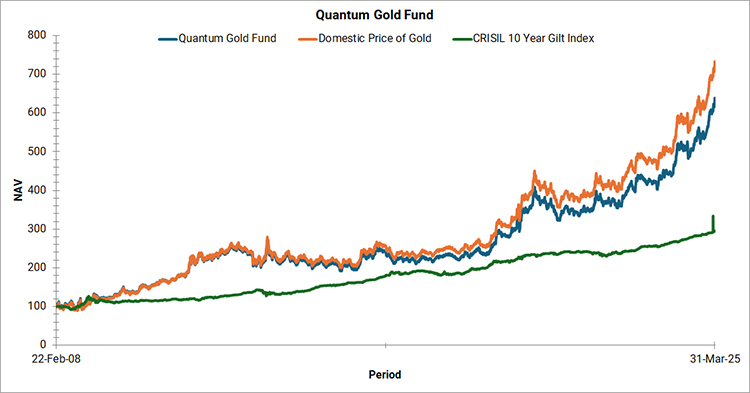
Performance and NAV chart of Quantum Gold Fund (QGF)
Mr. Chirag Mehta is the Fund Manager managing the scheme since June 1, 2024
| Value of investment of Rs. 10,000@ | Quantum Gold Fund (ETF) | |||||
|---|---|---|---|---|---|---|
| Period | Scheme Returns (%) | Tier I - Benchmark # Returns (%) | Tier II - Benchmark ## Returns (%) | Scheme (Rs.) | Tier I - Benchmark # Returns (Rs.) | Tier II - Benchmark ## Returns (Rs.) |
| Since Inception * | 13.76% | 14.69% | 6.28% | 1,04,358 | 1,21,178 | 30,310 |
| 10 years | 16.15% | 17.28% | 6.03% | 44,760 | 49,298 | 17,971 |
| 7 years | 23.58% | 24.76% | 6.15% | 44,075 | 47,099 | 15,186 |
| 5 years | 25.06% | 26.27% | 4.78% | 30,606 | 32,118 | 12,628 |
| 3 years | 34.19% | 35.55% | 6.35% | 24,223 | 24,967 | 12,035 |
| 1 year | 55.98% | 57.61% | 0.59% | 15,598 | 15,762 | 10,059 |
# Domestic Price of Gold ## CRISIL 10 Year Gilt Index
*Inception Date - February 22, 2008
Data as on April 30th 2026. Past performance may or may not be sustained in the future.
@ indicates the current value of Rs.10,000 invested at the beginning of a given period.
Returns are net of total expenses and are calculated on the basis of Compounded Annualized Growth Rate (CAGR) The Scheme being Exchange Traded Fund has one plan to invest through stock exchange and having a single expense structure. Chirag Mehta manages 8 schemes of Quantum Mutual Fund. Click here for performance details of other funds managed by him.
Past Performance may or may not be sustained in the future
Note: NAV & Benchmark data considered for above graph as on April 30th 2026
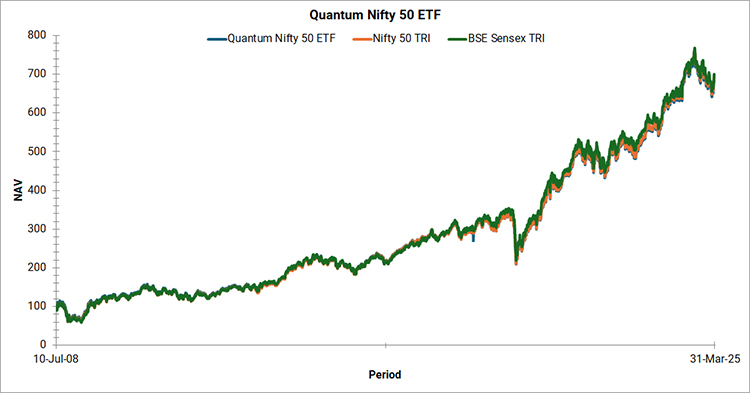
Performance and NAV chart of Quantum Nifty 50 ETF (QNifty)
Mr. Hitendra Parekh is the Fund Manager managing the scheme since July 10, 2008.
| Value of investment of Rs. 10,000@ | QUANTUM NIFTY 50 ETF | |||||||
|---|---|---|---|---|---|---|---|---|
| Period | Scheme Returns (%) | Tier I - Benchmark # Returns (%) | Tier II - Benchmark ## Returns (%) | Scheme (Rs.) | Tier I - Benchmark # Returns (Rs.) | Tier II - Benchmark ## Returns (Rs.) | ||
| Since Inception * | 11.58% | 11.65% | 11.53% | 70,436 | 71,192 | 69,829 | ||
| 10 years | 12.99% | 13.18% | 12.97% | 33,940 | 34,537 | 33,903 | ||
| 7 years | 11.87% | 12.03% | 11.48% | 21,937 | 22,168 | 21,406 | ||
| 5 years | 11.58% | 11.69% | 10.84% | 17,299 | 17,382 | 16,734 | ||
| 3 years | 11.06% | 11.18% | 9.26% | 13,710 | 13,753 | 13,052 | ||
| 1 year | -0.37% | -0.28% | -3.05% | 9,963 | 9,972 | 9,695 | ||
# Nifty 50 TRI ## BSE Sensex TRI
*Inception Date - July 10, 2008
Data as on April 30th 2026. Past performance may or may not be sustained in the future.
@ Indicates the current value of Rs. 10,000/- invested at the beginning of a given period.
Returns are net of total expenses and are calculated on the basis of Compounded Annualized Growth Rate (CAGR). The Scheme being Exchange Traded Fund has one plan to invest through stock exchange and having a single expense structure. IDCW of ₹80 was declared on 9 March 2018. Scheme return calculated above is inclusive of IDCW amount. Mr. Hitendra Parekh manages 2 schemes of the Quantum Mutual Fund. Click here for performance details of other funds managed by him.
Past Performance may or may not be sustained in the future
Note: NAV & Benchmark data considered for above graph as on April 30th 2026
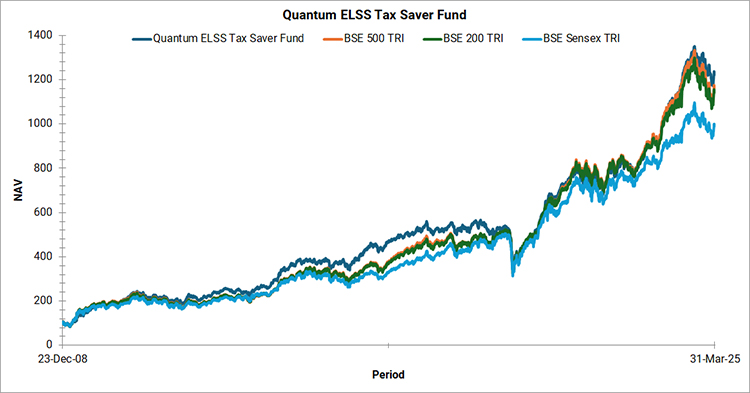
Performance and NAV chart of Quantum ELSS Tax Saver Fund (QETSF)
Mr. George Thomas Fund Manager managing the scheme since 1st April 2022.
Mr. Christy Mathai is the Fund Manager managing the scheme since November 23, 2022.
Mr. Ketan Gujarathi is the Associate Fund Manager managing the scheme since February 1, 2025.
The following scheme returns (%) shown is as per Direct Plan - Growth Option.
| Value of investment of Rs. 10,000@ | Quantum ELSS Tax Saver Fund - Direct Plan - Growth Option | |||||||
|---|---|---|---|---|---|---|---|---|
| Period | Scheme Returns (%) | Tier I - Benchmark # Returns (%) | Tier II - Benchmark ## Returns (%) | Additional Benchmark ### Returns (%) | Scheme (Rs.) | Tier I - Benchmark # Returns (Rs.) | Tier II - Benchmark ## Returns (Rs.) | Additional Benchmark ### Returns (Rs.) |
| Since Inception * | 15.58% | 15.63% | 15.46% | 14.16% | 1,23,539 | 1,24,418 | 1,21,350 | 99,715 |
| 10 years | 12.22% | 14.43% | 14.24% | 12.97% | 31,701 | 38,553 | 37,916 | 33,903 |
| 7 years | 12.15% | 14.16% | 13.75% | 11.48% | 22,324 | 25,291 | 24,665 | 21,406 |
| 5 years | 13.11% | 13.87% | 13.40% | 10.84% | 18,519 | 19,150 | 18,762 | 16,734 |
| 3 years | 15.28% | 14.90% | 14.26% | 9.26% | 15,337 | 15,186 | 14,935 | 13,052 |
| 1 year | -2.00% | 3.64% | 2.51% | -3.05% | 9,800 | 10,364 | 10,251 | 9,695 |
# BSE 500 TRI ## BSE 200 TRI ### BSE Sensex TRI
*Inception Date - December 23, 2008
Data as on April 30th 2026. Past performance may or may not be sustained in the future.
@ indicates the current value of Rs. 10,000/- invested at the beginning of a given period.
Different Plans shall have a different expense structure. Returns are net of total expenses and are calculated on the basis of Compounded Annualized Growth Rate (CAGR). Mr. George Thomas and Mr. Christy Mathai manage 2 schemes of Quantum Mutual Fund. Mr. Ketan Gujarathi manages 1 scheme of Quantum Mutual Fund. Click here for performance details of other funds managed by them.
Past Performance may or may not be sustained in the future
Note : NAV & Benchmark data considered for above graph as on April 30th 2026.
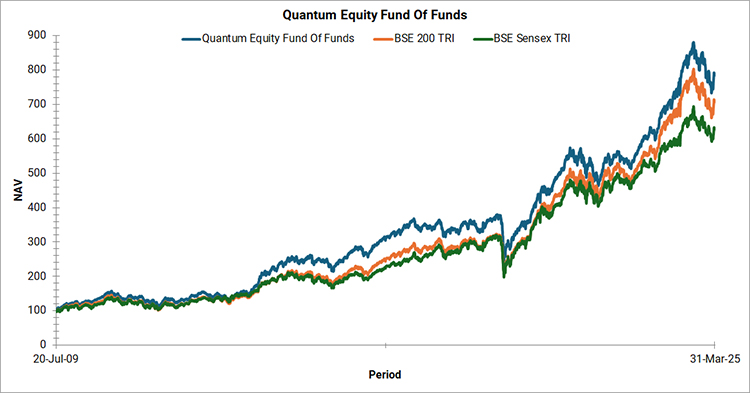
Performance and NAV chart of Quantum Diversified Equity All Cap Active FOF (QDEFOF)
Mr. Chirag Mehta is the Fund Manager managing the scheme since November 01, 2013.
Mr. Piyush Singh is the Associate Fund Manager effective from April 01, 2025.
The following scheme returns (%) shown is as per Direct Plan - Growth Option.
| Value of investment of Rs. 10,000@ | Quantum Diversified Equity All Cap Active FOF - Direct Plan - Growth Option | |||||
|---|---|---|---|---|---|---|
| Period | Scheme Returns (%) | Tier I - Benchmark # Returns (%) | Tier II - Benchmark ## Returns (%) | Scheme (Rs.) | Tier I - Benchmark # Returns (Rs.) | Tier II - Benchmark ## Returns (Rs.) |
| Since Inception * | 13.41% | 12.93% | 11.60% | 82,743 | 76,969 | 63,103 |
| 10 years | 12.91% | 14.43% | 12.97% | 33,701 | 38,553 | 33,903 |
| 7 years | 12.84% | 14.16% | 11.48% | 23,316 | 25,292 | 21,406 |
| 5 years | 12.98% | 13.87% | 10.84% | 18,416 | 19,150 | 16,734 |
| 3 years | 14.95% | 14.90% | 9.26% | 15,207 | 15,186 | 13,052 |
| 1 year | 2.14% | 3.64% | -3.05% | 10,214 | 10,364 | 9,695 |
# BSE 500 TRI ## BSE Sensex TRI
*Inception Date - July 20, 2009
Data as on April 30th 2026. Past performance may or may not be sustained in the future. Load is not taken into consideration in scheme returns calculation.
@ shows the current value of Rs. 10,000/- invested at the beginning of a given period.
Returns are net of total expenses and calculated on the basis of Compounded Annualized Growth Rate (CAGR). Mr. Chirag Mehta manages 8 Schemes of Quantum Mutual Fund. Mr. Piyush Singh manages 1 scheme of Quantum Mutual Fund. Click here for performance details of other funds managed by him.
Past Performance may or may not be sustained in the future
Note: NAV & Benchmark data considered for above graph as on April 30th 2026.
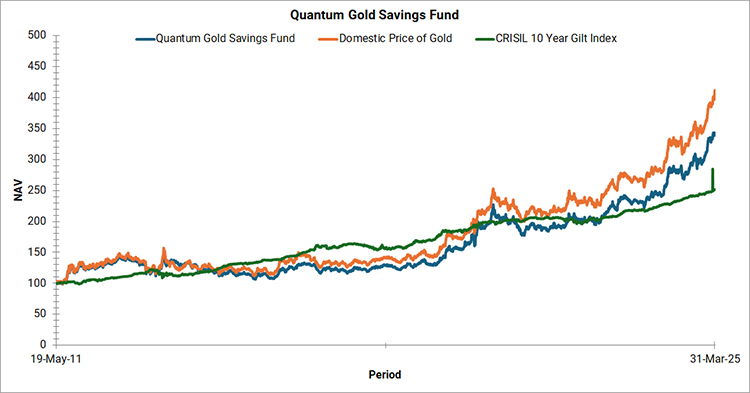
Performance and NAV chart of Quantum Gold Savings Fund (QGSF)
Mr. Chirag Mehta is the Fund Manager managing the scheme since May 19, 2011.
The following scheme returns (%) shown is as per Direct Plan - Growth Option.
| Value of investment of Rs. 10,000@ | Quantum Gold Savings Fund - Direct Plan - Growth Option | |||||
|---|---|---|---|---|---|---|
| Period | Scheme Returns (%) | Tier I - Benchmark # Returns (%) | Tier II - Benchmark ## Returns (%) | Scheme (Rs.) | Tier I - Benchmark # Returns (Rs.) | Tier II - Benchmark ## Returns (Rs.) |
| Since Inception * | 12.35% | 13.67% | 6.55% | 57,117 | 68,028 | 25,816 |
| 10 years | 16.27% | 17.28% | 6.03% | 45,204 | 49,298 | 17,971 |
| 7 years | 23.45% | 24.76% | 6.15% | 43,756 | 47,099 | 15,186 |
| 5 years | 24.95% | 26.27% | 4.78% | 30,478 | 32,118 | 12,628 |
| 3 years | 34.03% | 35.55% | 6.35% | 24,137 | 24,967 | 12,035 |
| 1 year | 56.63% | 57.62% | 0.59% | 15,663 | 15,762 | 10,059 |
# Domestic Price of Gold ## CRISIL 10 Year Gilt Index
*Inception Date - May 19, 2011
Data as on April 30th 2026. Past performance may or may not be sustained in the future.
@ shows the current value of Rs. 10,000/- invested at the beginning of a given period.
Different Plans have a different expense structure.
Returns are net of total expenses and are calculated on the basis of Compounded Annualized Growth Rate (CAGR).
This scheme is managed by Chirag Mehta. Click here for performance details of other funds managed by him.
Past Performance may or may not be sustained in the future
Note: NAV & Benchmark data considered for above graph as on April 30th 2026.
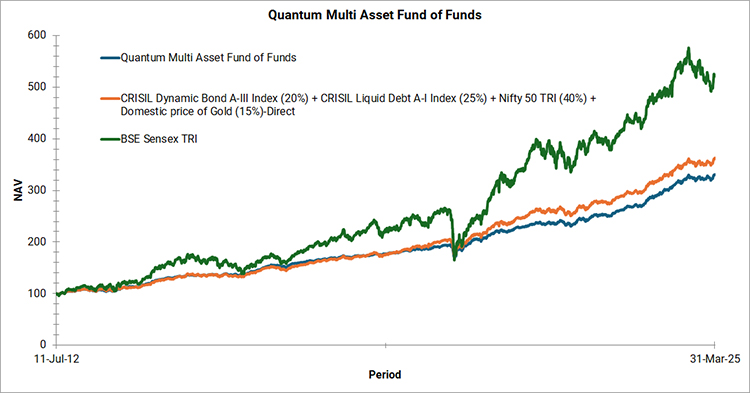
Performance and NAV chart of Quantum Multi Asset Active FOF (QMAAFOF)
Mr. Chirag Mehta managing the scheme since May 19, 2011.
Ms. Sneha Pandey is the Fund Manager managing the scheme since April 01, 2025.
Ms. Mansi Vasa is the Associate Fund Manager managing the scheme since April 01, 2025.
The following scheme returns (%) shown is as per Direct Plan - Growth Option.
| Value of investment of Rs. 10,000@ | Quantum Multi Asset Active FOF - Direct Plan - Growth Option | |||||
|---|---|---|---|---|---|---|
| Period | Scheme Returns (%) | Tier I - Benchmark # Returns (%) | Tier II - Benchmark ## Returns (%) | Scheme (Rs.) | Tier I - Benchmark # Returns (Rs.) | Tier II - Benchmark ## Returns (Rs.) |
| Since Inception * | 9.88% | 10.74% | 12.75% | 36,743 | 40,889 | 52,427 |
| 10 years | 9.88% | 11.23% | 12.97% | 25,664 | 29,003 | 33,903 |
| 7 years | 10.38% | 11.81% | 11.48% | 19,968 | 21,853 | 21,406 |
| 5 years | 10.54% | 11.46% | 10.84% | 16,511 | 17,209 | 16,734 |
| 3 years | 12.53% | 12.85% | 9.26% | 14,264 | 14,386 | 13,052 |
| 1 year | 8.09% | 9.65% | -3.05% | 10,809 | 10,965 | 9,695 |
# CRISIL Dynamic Bond A-III Index (20%) + CRISIL Liquid Debt A-I Index (25%) + Nifty 50 TRI (40%) + Domestic price of Gold (15%) ## BSE Sensex TRI
*Inception Date - July 11, 2012
Data as on April 30th 2026. Past performance may or may not be sustained in the future. Load is not taken into consideration in scheme returns calculation.
Different Plans shall have a different expense structure.
Returns are net of total expenses and are calculated on the basis of Compounded Annualized Growth Rate (CAGR). Mr. Chirag Mehta manages 8 Schemes of the Quantum Mutual Fund. Ms. Sneha Pandey manages 4 schemes of Quantum Mutual Fund. Ms. Mansi Vasa manages 2 schemes of Quantum Mutual Fund. Click here for performance details of other funds managed by them.
Past Performance may or may not be sustained in the future
Note: NAV & Benchmark data considered for above graph as on April 30th 2026.
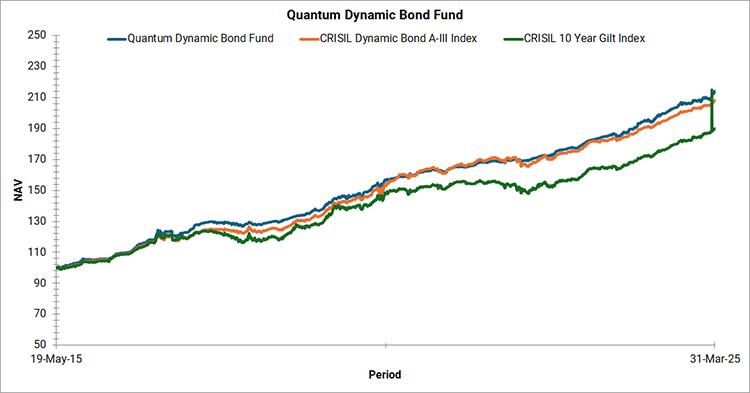
Performance and NAV chart of Quantum Dynamic Bond Fund (QDBF)
Ms. Sneha Pandey is the Fund Manager effective from April 01, 2025.
Mr. Mayur Chauhan is the Fund Manager effective from July 01, 2025.
The following scheme returns (%) shown is as per Direct Plan - Growth Option.
| Value of investment of Rs. 10,000@ | Quantum Dynamic Bond Fund - Direct Plan - Growth Option | |||||
|---|---|---|---|---|---|---|
| Period | Scheme Returns (%) | Tier I - Benchmark # Returns (%) | Tier II - Benchmark ## Returns (%) | Scheme (Rs.) | Tier I - Benchmark # Returns (Rs.) | Tier II - Benchmark ## Returns (Rs.) |
| Since Inception * | 7.55% | 7.30% | 6.28% | 22,194 | 21,634 | 19,494 |
| 10 years | 7.31% | 7.12% | 6.03% | 20,266 | 19,901 | 17,971 |
| 7 years | 7.10% | 7.13% | 6.15% | 16,168 | 16,198 | 15,186 |
| 5 years | 6.12% | 5.55% | 4.78% | 13,462 | 13,104 | 12,628 |
| 3 years | 6.94% | 6.38% | 6.35% | 12,238 | 12,046 | 12,035 |
| 1 year | 1.58% | 2.02% | 0.59% | 10,158 | 10,202 | 10,059 |
# CRISIL Dynamic Bond Fund AIII Index ## CRISIL 10 Year Gilt Index
*Inception Date - May 19, 2015
Data as on April 30th 2026. Past performance may or may not be sustained in the future.
@ shows the current value of Rs. 10,000/- invested at the beginning of a given period.
Different Plans have a different expense structure.
Returns are net of total expenses and are calculated on the basis of Compounded Annualized Growth Rate (CAGR). Ms. Sneha Pandey manages 4 schemes and Mr. Mayur Chauhan manages 2 schemes of the Quantum Mutual Fund. Click here for performance details of other funds managed by him.
Past Performance may or may not be sustained in the future
Note: NAV & Benchmark data considered for above graph as on April 30th 2026.
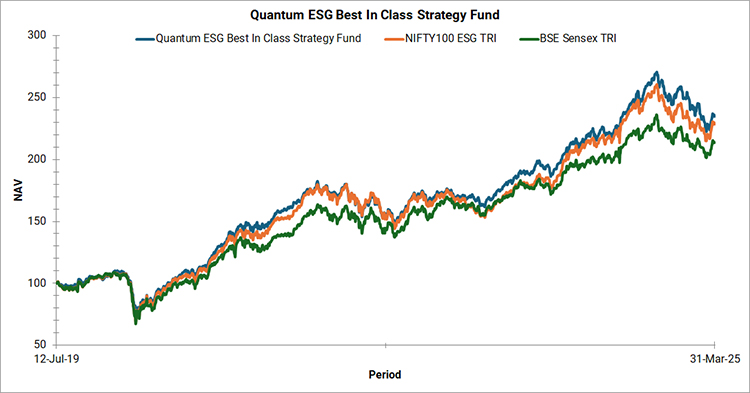
Performance and NAV chart of Quantum India ESG Equity Fund (QESG)
Mr. Chirag Mehta is the Fund Manager managing the scheme since July 12, 2019.
The following scheme returns (%) shown is as per Direct Plan - Growth Option.
| Value of investment of Rs. 10,000@ | Quantum ESG Best In Class Strategy Fund - Direct Plan - Growth Option | |||||
|---|---|---|---|---|---|---|
| Period | Scheme Returns (%) | Tier I - Benchmark # Returns (%) | Tier II - Benchmark ## Returns (%) | Scheme (Rs.) | Tier I - Benchmark # Returns (Rs.) | Tier II - Benchmark ## Returns (Rs.) |
| Since Inception * | 13.60% | 13.98% | 11.88% | 23,810 | 24,371 | 21,473 |
| 5 years | 10.36% | 11.93% | 10.84% | 16,376 | 17,575 | 16,734 |
| 3 years | 11.78% | 14.37% | 9.26% | 13,981 | 14,979 | 13,052 |
| 1 year | -0.83% | 3.67% | -3.05% | 9,917 | 10,367 | 9,695 |
# NIFTY100 ESG TRI ## BSE Sensex TRI
*Inception Date - July 12, 2019
Data as on April 30th 2026. Past performance may or may not be sustained in the future.
@ shows the current value of Rs. 10,000/- invested at the beginning of a given period.
Load is not taken into consideration in Scheme returns calculation.
Different Plans shall have a different expense structure.
Returns are net of total expenses and are calculated on the basis of Compounded Annualized Growth Rate (CAGR).
The Scheme is managed by Chirag Mehta. Click here for performance details of other funds managed by Chirag Mehta.
Past Performance may or may not be sustained in the future
Note: NAV & Benchmark data considered for above graph as on April 30th 2026.
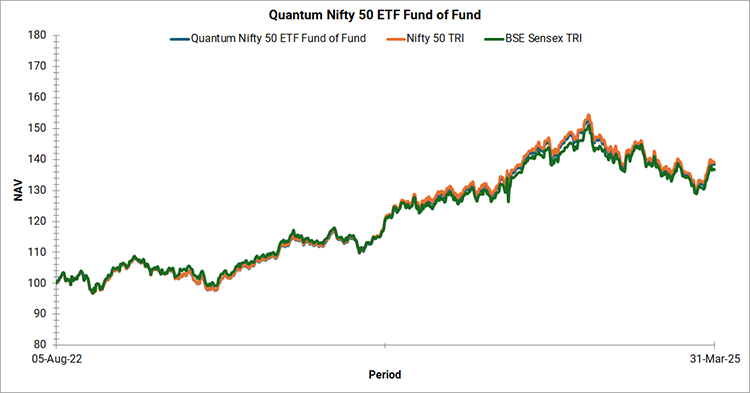
Performance and NAV chart of Quantum Nifty 50 ETF Fund of Fund (QNFOF)
Mr. Hitendra Parekh is the Fund Manager managing the scheme since August 05, 2022.
The following scheme returns (%) shown is as per Direct Plan - Growth Option.
| Value of investment of Rs. 10,000@ | Quantum Nifty 50 ETF Fund of Fund - Direct Plan - Growth Option | |||||
|---|---|---|---|---|---|---|
| Period | Scheme Returns (%) | Tier I - Benchmark # Returns (%) | Tier II - Benchmark ## Returns (%) | Scheme Returns - (Rs.) | Tier I - Benchmark # Returns (Rs.) | Tier II - Benchmark ## Returns (Rs.) |
| Since Inception * | 9.86% | 10.14% | 8.86% | 14,211 | 14,346 | 13,734 |
| 3 years | 10.94% | 11.18% | 9.26% | 13,665 | 13,753 | 13,052 |
| 1 year | -0.33% | -0.28% | -3.05% | 9,967 | 9,972 | 9,695 |
# Nifty 50 TRI ## S&P BSE Sensex TRI
*Inception Date - August 05, 2022
Data as on March 31st 2026. Past performance may or may not be sustained in the future.
Load is not taken into consideration in Scheme returns calculation.
Different Plans shall have a different expense structure.
The Schemes has been in existence for more than 1 year but has not yet completed 3 and 5 years period.
Returns are calculated on the basis of Compounded Annualized Growth Rate(CAGR).
Mr. Hitendra Parekh manages 2 Scheme of the Quantum Mutual Fund.
Past Performance may or may not be sustained in the future
Note: NAV & Benchmark data considered for above graph as on April 30th 2026.
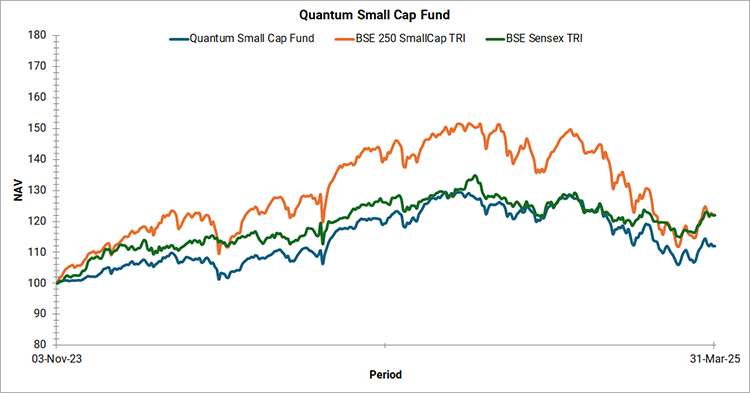
Performance and NAV chart of Quantum Small Cap Fund (QSCF)
Mr. Chirag Mehta is the Fund Manager managing the scheme since November 03, 2023.
Ms. Abhilasha Satale is the Associate Fund Manager managing the scheme since November 03, 2023.
The following scheme returns (%) shown is as per Direct Plan - Growth Option.
| Value of investment of Rs. 10,000@ | Quantum Small Cap Fund - Direct Plan - Growth Option | |||||
|---|---|---|---|---|---|---|
| Period | Scheme Returns (%) | Tier I - Benchmark # Returns (%) | Additional Benchmark ## Returns (%) | Scheme Returns - (Rs.) | Tier I - Benchmark # Returns (Rs.) | Additional Benchmark ## Returns (Rs.) |
| Since Inception * | 10.04% | 13.02% | 8.51% | 12,690 | 13,564 | 12,257 |
| 1 year | 11.51% | 8.81% | -3.05% | 11,151 | 10,881 | 9,695 |
# BSE 250 SmallCap TRI ## Nifty SmallCap 250 TRI
*Inception Date - November 03, 2023
Data as on March 31st 2026. Past performance may or may not be sustained in the future.
Load is not taken into consideration in Scheme returns calculation.
Different Plans shall have a different expense structure.
Returns are calculated on the basis of Compounded Annualized Growth Rate(CAGR).
The Scheme is managed by Chirag Mehta and Abhilasha Satale.
Past Performance may or may not be sustained in the future
Note: NAV & Benchmark data considered for above graph as on April 30th 2026.
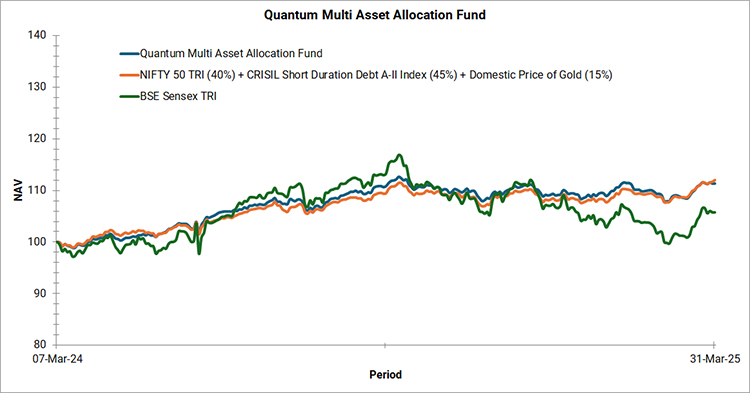
Performance and NAV chart of Quantum Multi Asset Allocation Fund (QMAAF)
Mr. Chirag Mehta is the Fund Manager managing the scheme since November 03, 2023.
Ms. Sneha Pandey is the Fund Manager managing the scheme since April 01, 2025.
Ms. Mansi Vasa is the Associate Fund Manager managing the scheme since April 01, 2025.
The following scheme returns (%) shown is as per Direct Plan - Growth Option.
| Value of investment of Rs. 10,000@ | Quantum Multi Asset Allocation Fund - Direct Plan - Growth Option | |||||
|---|---|---|---|---|---|---|
| Period | Scheme Returns (%) | Tier I - Benchmark # Returns (%) | Tier II - Benchmark ## Returns (%) | Scheme Returns - (Rs.) | Tier I - Benchmark # Returns (Rs.) | Tier II - Benchmark ## Returns (Rs.) |
| Since Inception * | 9.53% | 11.71% | 2.86% | 12,160 | 12,685 | 10,625 |
| 1 year | 5.92% | 10.26% | -3.05% | 10,592 | 11,026 | 9,695 |
# NIFTY 50 TRI (40%) + CRISIL Short Duration Debt A-II Index (45%) + Domestic Price of Gold (15%) ## BSE Sensex TRI
*Inception Date - March 07, 2024
Data as on April 30th 2026. Past performance may or may not be sustained in the future. Load is not taken into consideration in Scheme returns calculation.
Different Plans shall have a different expense structure.
Returns are calculated on the basis of Compounded Annualized Growth Rate(CAGR).
The Scheme is managed by Mr. Chirag Mehta manages 8 schemes of Quantum Mutual Fund. Ms. Sneha Pandey manages 4 schemes of Quantum Mutual Fund. Ms. Mansi Vasa manages 2 schemes of Quantum Mutual Fund. Click here for performance details of other funds managed by them.
Past Performance may or may not be sustained in the future
Note: NAV & Benchmark data considered for above graph as on April 30th 2026.
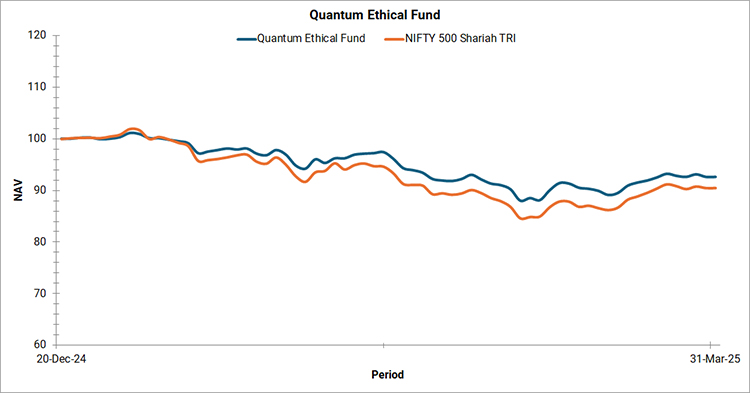
Performance and NAV chart of Quantum Ethical Fund (QETHICAL)
The Scheme is managed by Mr. Chirag Mehta
Mr. Chirag Mehta is the Fund Manager effective from December 20, 2024.
The following scheme returns (%) shown is as per Direct Plan - Growth Option.
| Value of investment of Rs. 10,000@ | Quantum Ethical Fund - Direct Plan - Growth Option | |||||
|---|---|---|---|---|---|---|
| Period | Scheme Returns (%) | Tier I - Benchmark # Returns (%) | Tier II - Benchmark ## Returns (%) | Scheme Returns - (Rs.) | Tier I - Benchmark # Returns (Rs.) | Tier II - Benchmark ## Returns (Rs.) |
| Since Inception * | -3.48% | -5.01% | -0.12% | 9,530 | 9,325 | 9,984 |
| 6 Months | 1.93% | 1.24% | -3.05% | 10,193 | 10,124 | 9,695 |
# NIFTY 500 Shariah TRI ## BSE Sensex TRI
*Inception Date - December 20, 2024
Data as on April 30th 2026. Past performance may or may not be sustained in the future. Load is not taken into consideration in Scheme returns calculation.
Different Plans shall have a different expense structure.
Mr. Chirag Mehta manages 8 schemes of Quantum Mutual Fund. Click here for performance details of other funds managed by them.
Past Performance may or may not be sustained in the future
Note: NAV & Benchmark data considered for above graph as on April 30th 2026.
Things to know before you sign the dotted line
For an investment experience to be truly satisfying it is important that the investor has basic understanding of features of the scheme being chosen, how it works to generate returns and is aware of risks attached to the investment. This is very important for avoiding mismatch in product chosen vis-à-vis your investment need. But above all it will give investors peace of mind as they are equipped with information to make correct & timely decisions with their investment.
As a Quantum investor here is a general list of what you should have knowledge of while choosing our schemes:
• Expense ratio and exit load of the chosen scheme. Make sure you know how exit load would apply (if in case it would) while redeeming your investment, Cutoff time for NAV applicability during subscription, redemption, switch transactions and the turnaround time for processing these transactions. NAV affects the number of units you’d be allotted during subscription and investment value on redemption.
• Tax implications on different schemes as may be applicable on your returns from the investment.
• Nature and extent of risk attached to the scheme chosen. Understand that mutual funds are pass through medium which invest money pooled from investors in market securities and pass on whatever returns are generated back to investors after deducting their fees (expense ratio). Thus mutual fund returns are not guaranteed.
The product label of schemes denotes their comparative risk. Investors should be aware of their risk appetite which is usually a function of their investment goal and time horizon, and choose funds whose investment objective is suited to help them achieve their goal.
• Policies and procedures of Grievance Redressal and Dispute Resolution at Quantum Mutual Fund.
The offer documents of a mutual fund scheme - Scheme Information Document, Statement of Additional Information and Key Information Memorandum contain information on all aspects relating to the scheme that an investor should have awareness of. Kindly go through it before making investment. Our executives would be glad too to guide investors whenever assistance is required.
Product Labeling
The riskometer in the Product Label depicts the degree of risk your principal is exposed to when it is invested in a particular scheme. It gives a quick-view of the risk level of your investment.
| Name of the Scheme | This product is suitable for investors who are seeking* | Risk-o-meter of Scheme | Risk-o-meter of Tier I & II - Benchmark |
|---|---|---|---|
| Quantum Value Fund (An Open Ended Equity Scheme following a Value Investment Strategy) Tier I Benchmark: BSE 500 TRI Tier II Benchmark: BSE 200 TRI | • Long term capital appreciation • Invests primarily in equity and equity related securities of companies in BSE 200 index. |  | 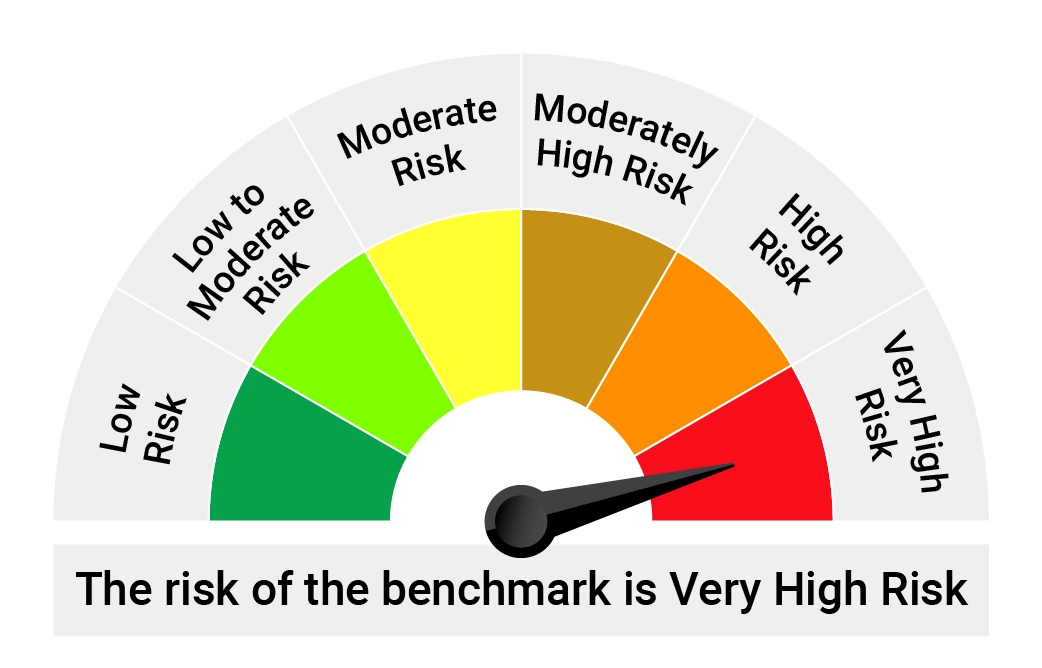 |
| Quantum ELSS Tax Saver Fund (An Open Ended Equity Linked Saving Scheme with a Statutory Lock in of 3 years and Tax Benefit) Tier I Benchmark: BSE 500 TRI Tier II Benchmark: BSE 200 TRI | • Long term capital appreciation • Invests primarily in equity and equity related securities of companies in BSE 200 index and to save tax u/s 80 C of the Income Tax Act. Investments in this product are subject to lock in period of 3 years. | | |
| Name of the Scheme | This product is suitable for investors who are seeking* | Risk-o-meter of Scheme | Risk-o-meter of Tier I - Benchmark |
|---|---|---|---|
| Quantum Liquid Fund (An Open-ended Liquid Scheme. A relatively low interest rate risk and relatively low credit risk.) Tier I Benchmark: CRISIL Liquid Debt A-I Index | • Income over the short term • Investments in debt / money market instruments. | 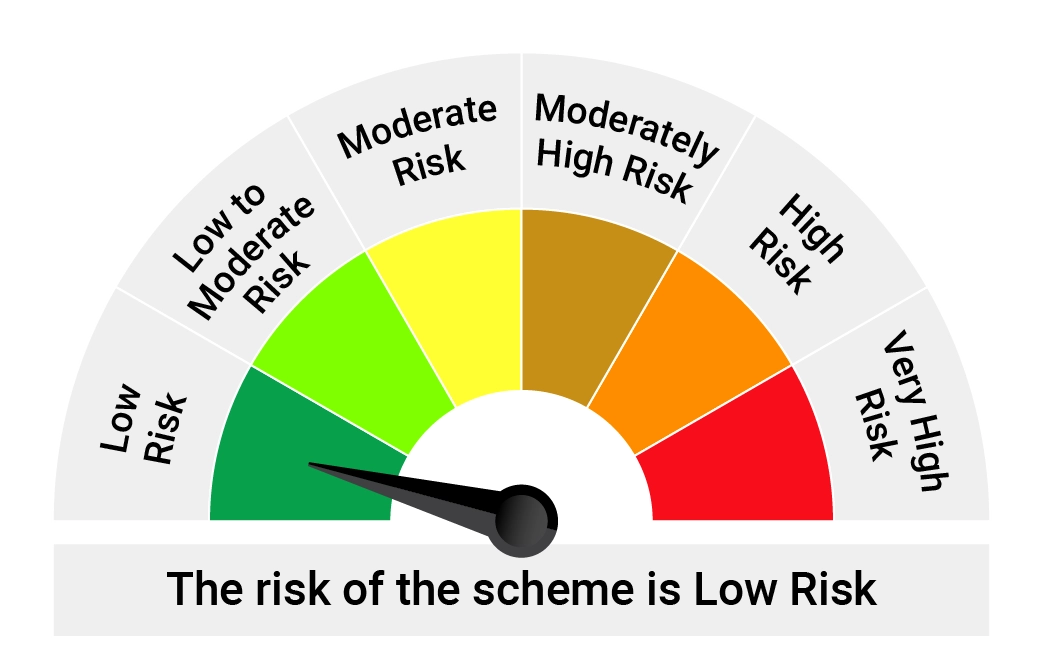 | 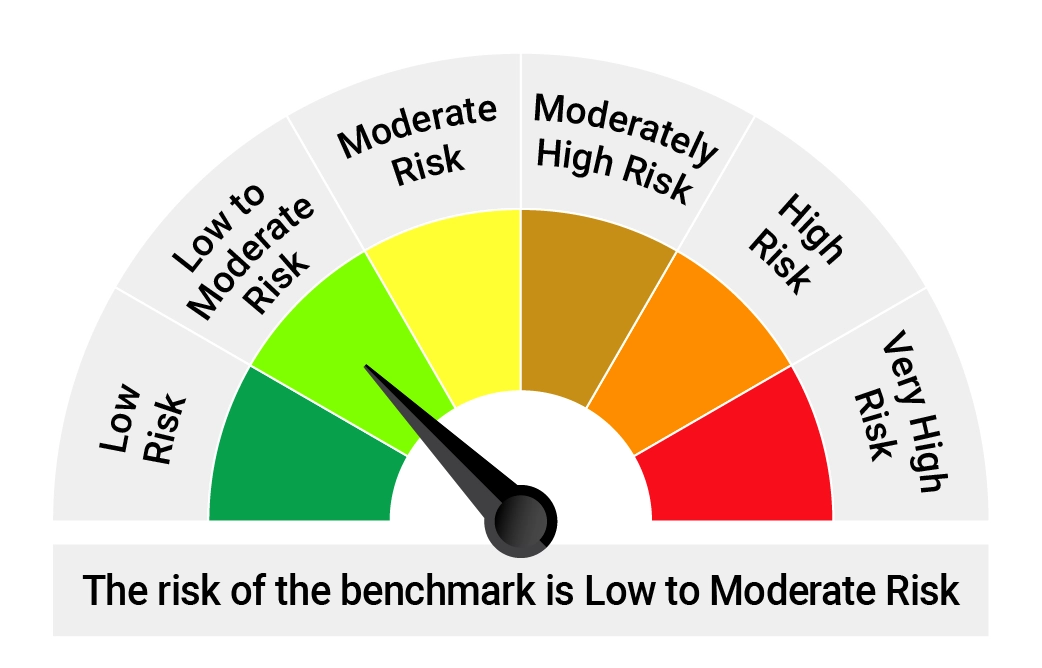 |
| Quantum Gold Fund (An Open Ended Scheme Replicating / Tracking Gold) Tier I Benchmark: Domestic Price of Gold | • Long term returns • Investments in physical gold. |  |  |
| Quantum Nifty 50 ETF (An Open Ended Scheme Replicating / Tracking Nifty 50 Index) Tier I Benchmark: Nifty 50 TRI | • Long term capital appreciation • Investments in equity and equity related securities of companies in Nifty 50 Index. | | |
| Quantum India ESG Equity Fund (An Open ended equity scheme investing in companies following Environment, Social and Governance (ESG) theme) Tier I Benchmark: NIFTY100 ESG TRI | • Long term capital appreciation • Invests in shares of companies that meet Quantums Environment, Social, Governance (ESG) criteria. | | |
| Quantum Diversified Equity All Cap Active FOF (An Open-Ended Fund of Funds Scheme investing in diversified Equity Schemes across All Market Caps of Mutual Funds) Tier I Benchmark: BSE 500 TRI | • Long term capital appreciation • Investments in portfolio of diversified Equity Schemes across All Market Caps of Mutual Funds | | |
| Quantum Gold Savings Fund (An Open Ended Fund of Fund Scheme Investing in Quantum Gold Fund) Tier I Benchmark: Domestic Price of Gold | • Long term returns • Investments in units of Quantum Gold Fund - Exchange Traded Fund whose underlying investments are in physical gold. | | |
| Quantum Multi Asset Active FOF (An Open-Ended Fund of Funds scheme investing in Equity-oriented schemes, Debt oriented schemes and Gold based schemes) Tier I Benchmark : CRISIL Dynamic Bond A-III Index (20%) + CRISIL Liquid Debt A-I Index (25%) + Nifty 50 TRI (40%) + Domestic price of Gold (15%) | • Long term capital appreciation and current income • Investments in portfolio of schemes of Equity oriented Schemes, Debt oriented Schemes and Gold based Schemes of Quantum Mutual Fund. | 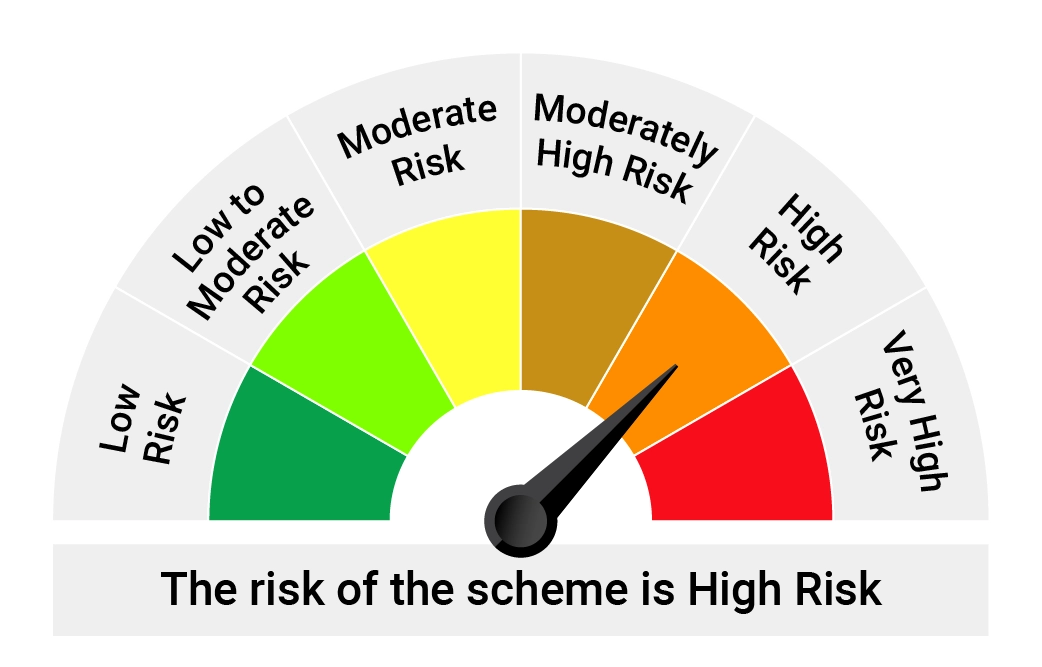 | 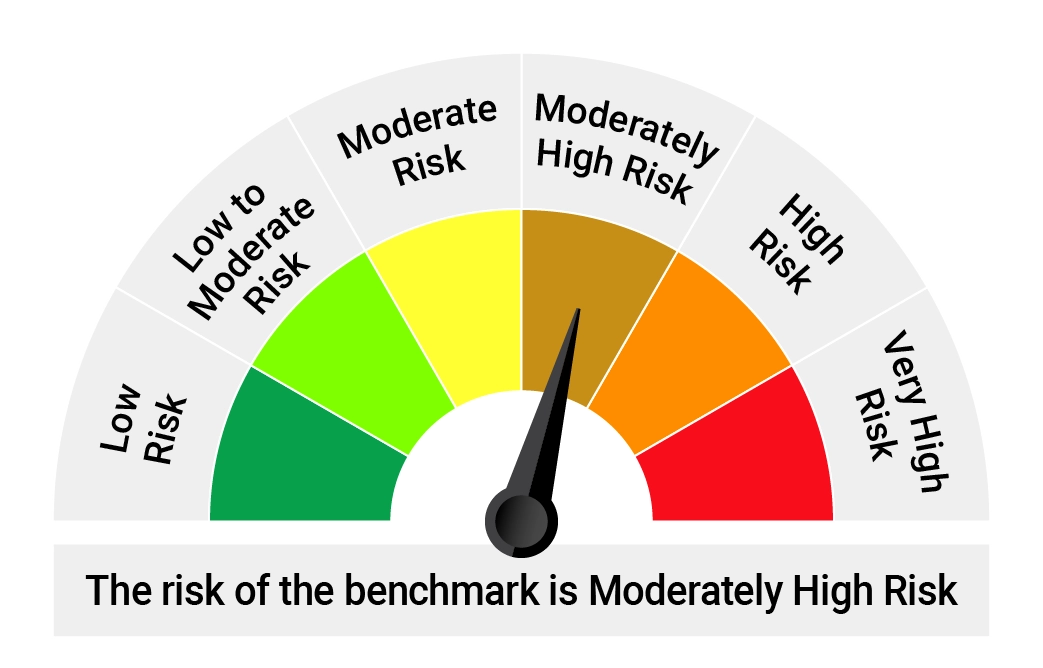 |
| Quantum Dynamic Bond Fund (An Open-ended Dynamic Debt Scheme Investing Across Duration. A relatively high interest rate risk and relatively low credit risk.) Tier I Benchmark: CRISIL Dynamic Bond Fund AIII Index | • Regular income over short to medium term and capital appreciation • Investment in Debt / Money Market Instruments / Government Securities. |  | 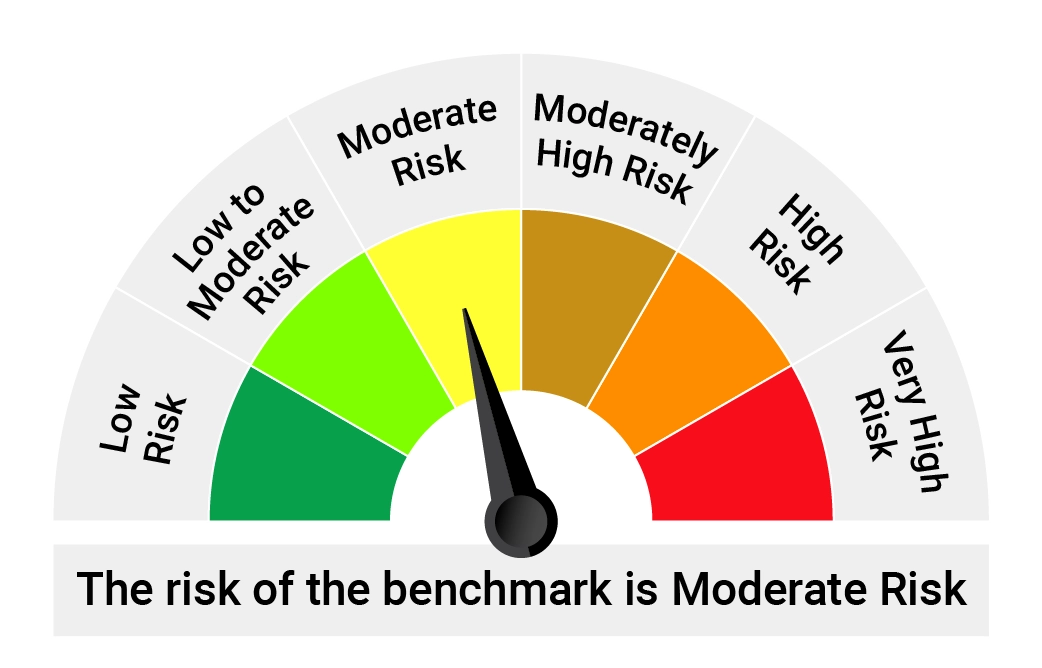 |
| Quantum Nifty 50 ETF Fund of Fund (An Open ended Fund of Fund Scheme investing in units of Quantum Nifty 50 ETF) Tier I Benchmark: Nifty 50 TRI | • Long term capital appreciation • Investments in units of Quantum Nifty 50 ETF – Exchange Traded Fund | | |
| Quantum Small Cap Fund (An Open Ended-Equity Scheme Predominantly Investing in Small Cap Stocks) Tier I Benchmark: BSE 250 Small Cap TRI | • Long term capital appreciation • Investment in Small Cap Stock | | |
| Quantum Multi Asset Allocation Fund (An Open-Ended Scheme Investing in Equity & Equity Related Instruments, Debt & Money Market Instruments and Gold Related Instruments) Tier I Benchmark: NIFTY 50 TRI (40%) + CRISIL Short Duration Debt A-II Index (45%) + Domestic Price of Gold (15%) | • Long term capital appreciation and current income • Investment in a Diversified Portfolio of Equity & Equity Related Instruments, Debt & Money Market Instruments and Gold Related Instruments | | |
| Quantum Ethical Fund (An Open-Ended Equity Scheme following an Ethical Theme) Tier I Benchmark : NIFTY 500 Shariah TRI | • Long term capital appreciation • Investments in Equity & Equity Related Instruments of companies following an Ethical Set of Principles | | |
*Investors should consult their financial advisers if in doubt about whether the product is suitable for them.
The investors of Quantum Diversified Equity All Cap Active FOF, Quantum Gold Savings Fund, Quantum Multi Asset Active FOF and Quantum Nifty 50 ETF Fund of Fund will bear the Scheme expenses in addition to the expenses of other schemes in which Fund of Funds scheme makes investment (subject to regulatory limits).
| Potential Risk Class Matrix - Quantum Liquid Fund | |||
|---|---|---|---|
Credit Risk → Interest Rate Risk↓ | Relatively Low (Class A) | Moderate (Class B) | Relatively High (Class C) |
| Relatively Low (Class I) | A-I | ||
| Moderate (Class II) | |||
| Relatively High (Class III) | |||
| Potential Risk Class Matrix - Quantum Dynamic Bond Fund | |||
|---|---|---|---|
Credit Risk → Interest Rate Risk↓ | Relatively Low (Class A) | Moderate (Class B) | Relatively High (Class C) |
| Relatively Low (Class I) | |||
| Moderate (Class II) | |||
| Relatively High (Class III) | A-III | ||
heading
Risk Factors: Mutual Fund investments are subject to market risks, read all scheme related documents carefully.
Risk Factors and Disclaimer:-
This view expressed in this article does not constitute any guidelines or recommendation on any course of action to be followed by the reader. The views are based on the publicly available information, internally developed data and other sources believed to be reliable. The views are meant for general reading purpose only and are not meant to serve as a professional guide / investment advice / intended to be an offer or solicitation for the purchase or sale of any financial product or instrument or mutual fund units for the readers. Whilst no action has been solicited based upon the information provided herein, due care has been taken to ensure that the facts are accurate and opinions given fair and reasonable. Recipients of this information should rely on information/data arising out of their own investigations. Readers are advised to seek independent professional advice and arrive at an informed investment decision before making any investments. None of The Sponsor, The Investment Manager, The Trustee, their respective directors, employees, affiliates or representatives shall be liable for any direct, indirect, special, incidental, consequential, punitive or exemplary damages, including lost profits arising in any way from the information contained in this document.
Please visit - www.quantumamc.com/disclaimer to read scheme specific risk factors. Investors in the Scheme(s) are not being offered a guaranteed or assured rate of return and there can be no assurance that the schemes objective will be achieved and the NAV of the scheme(s) may go up and down depending upon the factors and forces affecting securities market. Investment in mutual fund units involves investment risk such as trading volumes, settlement risk, liquidity risk, default risk including possible loss of capital. Past performance of the sponsor / AMC / Mutual Fund does not indicate the future performance of the Scheme(s). Statutory Details: Quantum Mutual Fund (the Fund) has been constituted as a Trust under the Indian Trusts Act, 1882. Sponsor: Quantum Advisors Private Limited. (liability of Sponsor limited to Rs. 1,00,000/-) Trustee: Quantum Trustee Company Private Limited Investment Manager: Quantum Asset Management Company Private Limited. The Sponsor, Trustee and Investment Manager are incorporated under the Companies Act, 1956.

