Digital Factsheet
Equity Funds
Debt Funds
Gold Funds
Multi Asset Funds
Navigate Unpredictability: Achieve your Financial Goals with
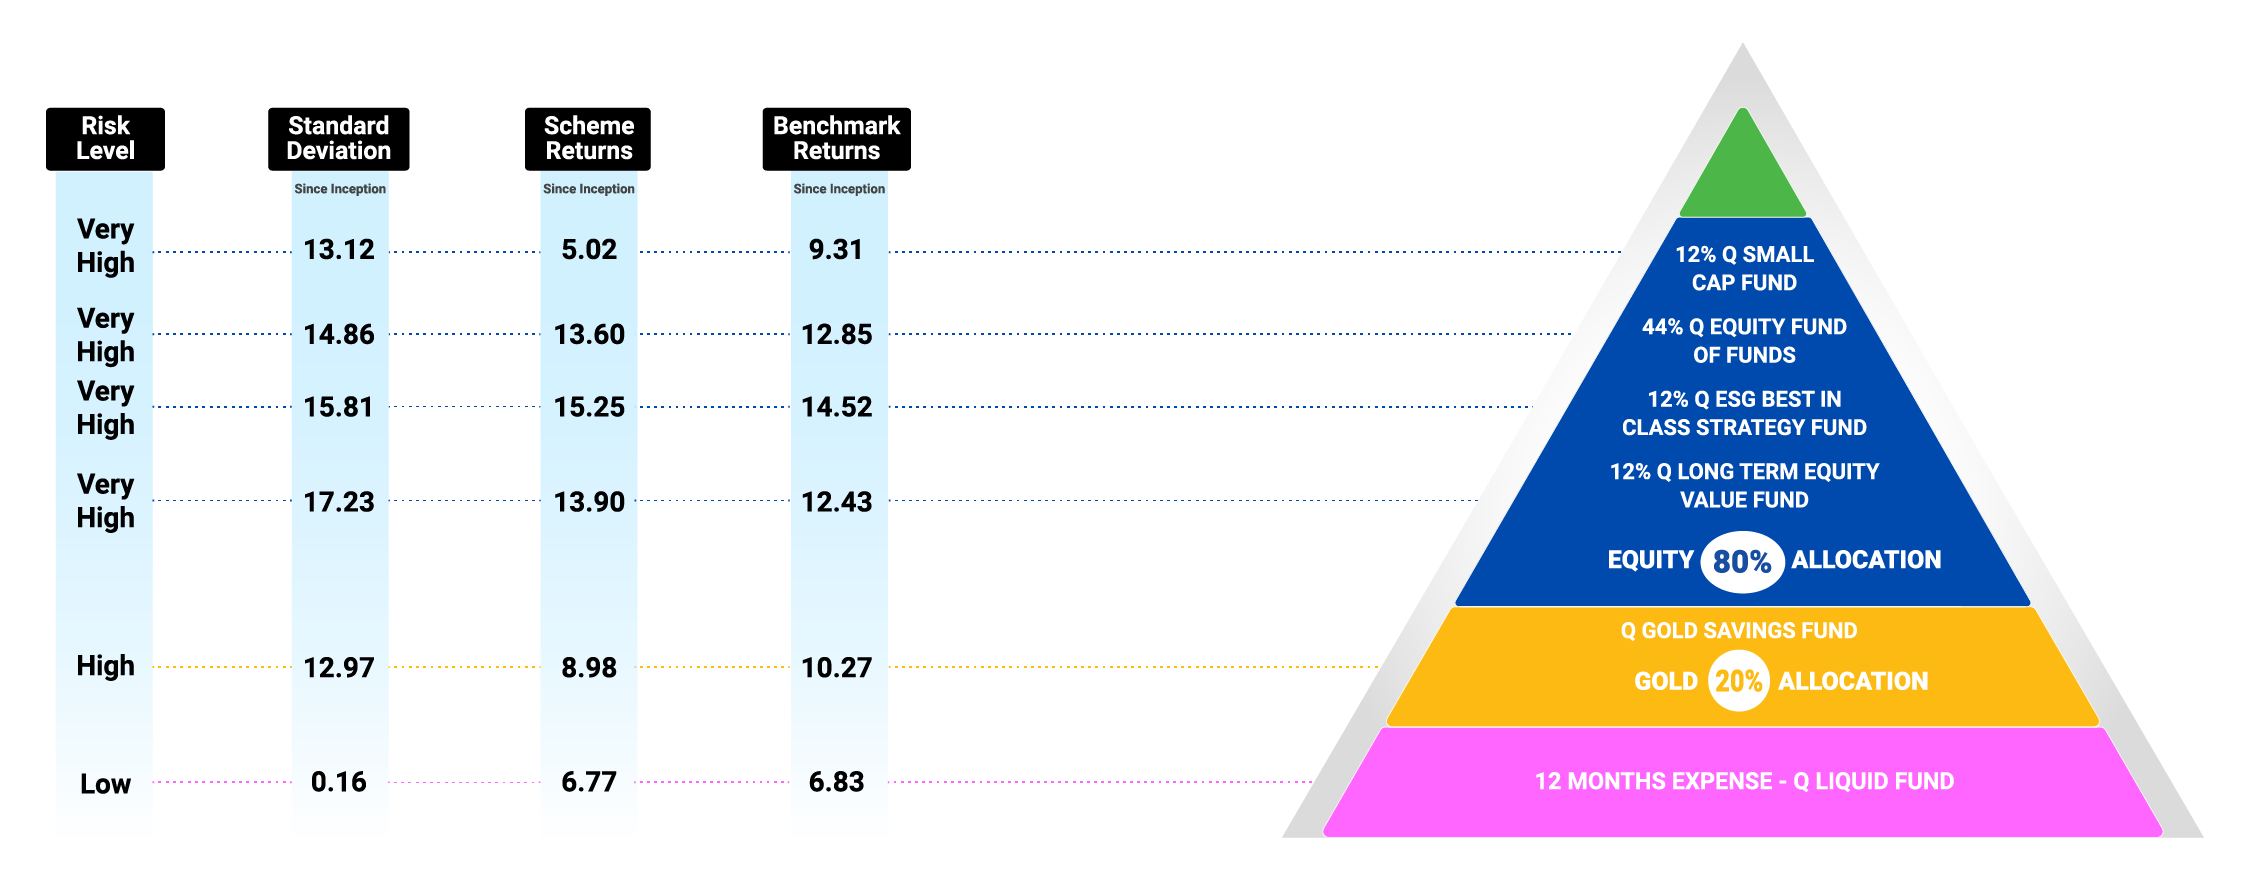
Quantum’s 12|20:80* (Barah Bees Assi) Asset Allocation Approach

Data as of July 31st, 2025. Past Performance may or may not be sustained in the future. The above performance is of the Direct Plan. To view complete performance for the schemes, refer to pages 50 to 54. Please note the above is a suggested fund allocation and not to be considered as an investment advice or recommendation. Quantum Value Fund- Tier I Benchmark: BSE 500 TRI, Quantum Small Cap Fund - Tier I Benchmark: BSE 250 SmallCap TRI, Quantum ESG Best In Class Strategy Fund- Tier I Benchmark: NIFTY100 ESG TRI, Quantum Gold Savings Fund - Tier I Benchmark: Domestic Price of Gold, Quantum Liquid Fund- Tier I Benchmark: CRISIL Liquid Debt A-I Index, Quantum Equity Fund of Funds - Tier I Benchmark: BSE 200 TRI.
*Please note the above is a suggested Asset allocation and not to be considered as an investment advice / recommendation. The name of Quantum Long Term Equity Value Fund has been changed to Quantum Value Fund effective from May 01, 2025


