Three points to ponder
Posted On Monday, Dec 18, 2017
Bazar kem che? Kya Lagta hai Bazar? What do you think of the market? Anything to be worried about? These are questions periodically faced when working in the field of investments. I am not trained to take a view on the overall markets which I find to be unpredictable. However I am trained to worry and ponder.
As a portfolio manager; particularly the value kind, there are numerous issues to ponder about. To enumerate;
Point to Ponder # 1
Where is the value?
The valuation of the Sensex and the Mid cap index look expensive on a P/E basis. For the statistically inclined the current P/E is two standard deviations from the mean. In simpler terms it means the current P/E is substantially above the long term average.
See below:
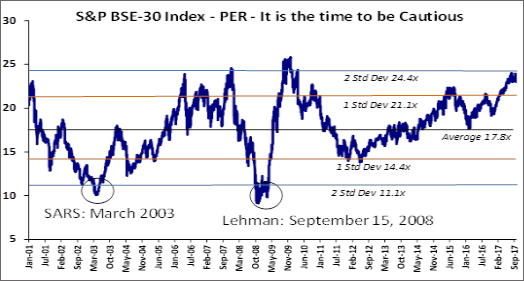
Source:Bloomberg
On previous occasions, whenever the P/E was close to 1 standard deviation (SD) or 2 SD, the returns over the next two to three years have not been good (See table below). While this is a view on the overall market, there is no denying that individual stocks may be attractively valued.
1 Standard Deviation - From Long Term Mean
| Dates | 2 Year CAGR | 3 Year CAGR |
| Apr-06 | -7.1% | -11.2% |
| Dec-06 | -26.9% | 4.0% |
| Oct-07 | 5.0% | -0.5% |
| Jan-08 | 2.5% | -5.3% |
| Sep-09 | -16.0% | -9.5% |
| May-15 | 3.3% | ** |
| All the above numbers are in INR ** 3 years not completed | ||
2 Standard Deviation - From Long Term Mean
| Dates | 2 Year CAGR | 3 Year CAGR |
| Oct-09 | -17.8% | -13.3% |
| Mar-10 | -21.2% | -11.8% |
| All the above numbers are in INR ** 3 years not completed | ||
Similarly, poor returns can be seen in Mid cap index whenever the PE ratio has crossed 1 standard deviation (SD) or 2 SD from the mean.
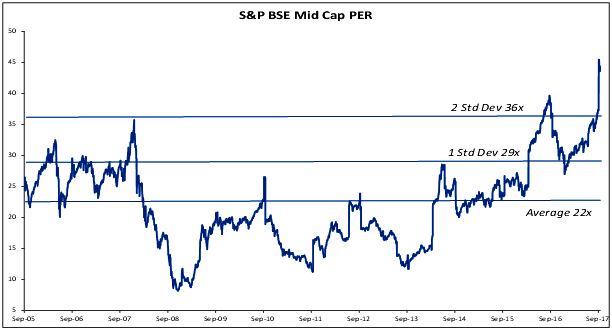
Source: Bloomberg
1 Standard Deviation - From Long Term Mean
| Dates | 2 Year CAGR | 3 Year CAGR |
| Mar-06 | -18.8% | -29.1% |
| May-06 | -16.5% | -15.1% |
| Dec-06 | -38.4% | -13.2% |
| Nov-07 | -18.7% | -14.5% |
| Jan-08 | -16.1% | -16.8% |
| Mar-16 | ** | ** |
| All the above numbers are in INR. ** 2 and 3 years not completed. | ||
2 Standard Deviation - From Long Term Mean
| Dates | 2 Year CAGR | 3 Year CAGR |
| Jan-08 | -28.2% | -25.1% |
| Jul-16 | ** | ** |
| Sep-16 | ** | ** |
| Sep-17 | ** | ** |
| All the above numbers are in INR. ** 2 and 3 years not completed. | ||
Point to Ponder # 2
Where to invest?
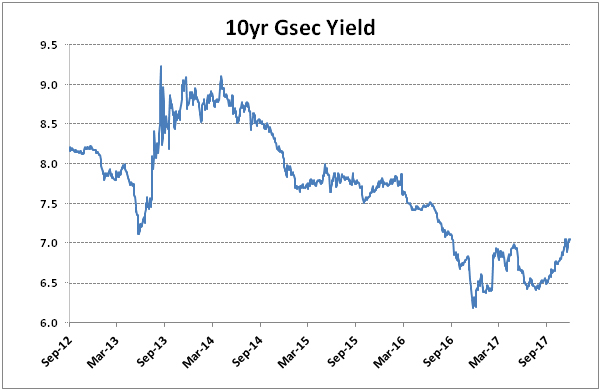
With equities appearing a little worrisome, how about moving to debt was the next question to ponder? However;
With the fiscal deficit already reaching 97% of the annual target, worries about slippage in deficit more than what the government had planned for i.e. 3.2% and the consequent impact on interest rates cropped up. Stress on rural economy and small business could exercise further strain on the economy as government tries to guide them out of the stress. Slippage in deficit could also result from lower tax collections as the teething issues of GST roll out are not yet complete. Any increase in oil prices could exercise pressure on current account deficit and also bring in inflationary threat. All of the above means, risk of an uptick in interest rates.
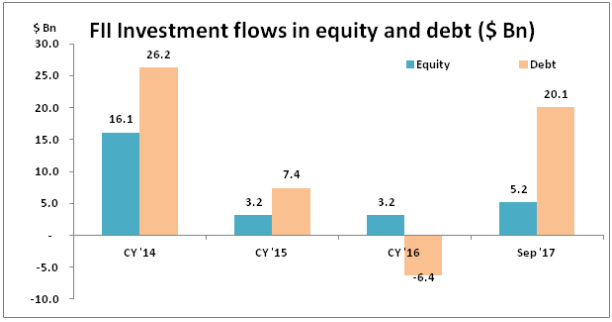
| Cumulative Fll inflows ($ billion) | |||
| Period | Equity | Debt | Total |
| CY'14 - Sep' 17 | 27.7 | 47.4 | 75.1 |
So what is the problem in an uptick in interest rates? Much of the flows into India has come into debt market (see graph and table above); and a spike in interest rates may spook the bond market investors. Any sell off by foreigners holding bond investment may cause the currency to depreciate and prompt the equity holders to sell as well.
Point to Ponder # 3
Does residential real estate look attractive?
Builders in large cities are reporting slower growth in real estate sales. This view is counter to the numbers reported by home loan companies. Maybe there is appetite in smaller towns for residential properties, hence the loan growth. Despite the slower sales in the larger cities, prices have not declined to levels to make It attractive. So real estate is also out.
Maybe it is just a good time to keep investments in cash funds.
Part of the reason for asset prices to look expensive is the easy avalaibility of money globally. This has pushed up asset prices, and in some categories/products to levels that defies conventional wisdom.
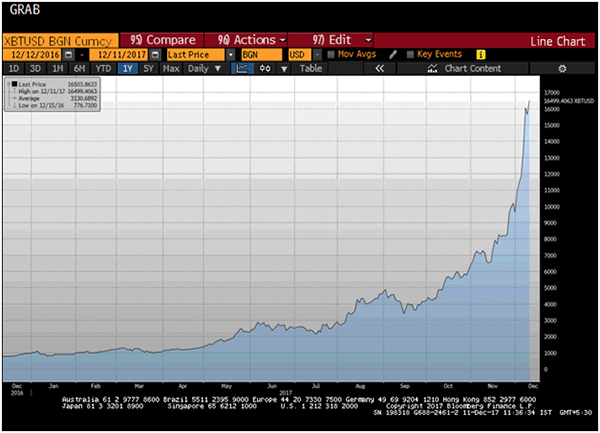
Elsewhere bubbles are formed?
The easy flow of money maybe creating bubbles across the world. I don’t understand much on bitcoinsthough I am fascinated by the concept. However when my well experienced collegue Ajit looking at the below mentioned chart says “it is time to close the window and go to sleep” , I would be weary of advising anyone to venture into this.
Conclusion: Net for retail investor, it makes sense to keep SIP investment on, and relook at the portfolio and maybe reshuffle it towards the large cap and less towards small cap or mid cap
View All
Related Posts
-

Invest without Stress - With Quantum Mutual Fund!
Posted On Monday, May 09, 2022
Since inception, Quantum AMC has stayed true to its Vision and Mission.
Read More -

Active or Passive Investing: Which Style is Right for You?
Posted On Tuesday, Apr 26, 2022
With such a wide variety of investment avenues and styles, you may be confused as to which is the best for you.
Read More -

Stay Ahead of Inflation During These Uncertain Times
Posted On Wednesday, Apr 13, 2022
Inflation has been slowly but steadily eating into the savings of investors.
Read More

