The FED, The RBI and Mr. Bond
Posted On Friday, Oct 21, 2022
“If there was incarnation…I would like to come back as the bond market. You can intimidate everybody”.
James Carville (Advisor to former US president Bill Clinton) must have said this as a joke. But, the movement in the bond markets over the past two months have really been intimidating for everyone from policy makers to investors. British government’s U-turn on the tax cut proposal after bond sell off is a live testimony of this.
Bond yields have been rising for the last two years. But, its sharp up move in the last two months have been particularly destabilizing for markets. Over the last two and half month (since July 31, 2022 till October 18, 2022), the 2 year US treasury yield has moved up by 154 basis points from 2.89% to 4.43%. Bond yield in other advanced and emerging economies have followed the US treasury yields.
In advance economies, these level of interest rates have not been seen for very long time. This is an unknown territory for many of the financial models built on the last 10-15 years of market data. Financial system is becoming increasing sensitive to interest rates beyond a level.
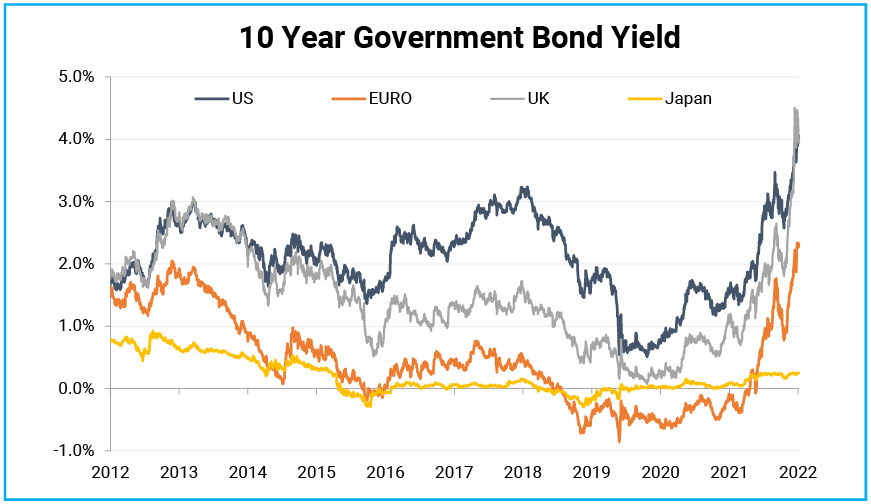
Source – Bloomberg, Quantum Research, Data as of October 18, 2022
Past performance may or may not sustain in future
FED’s dilemma
The US FED and many other central banks in advanced economies are laser focused on controlling inflation. They are hiking interest rates and unwinding liquidity support at a historic pace.
The aggressive pace of rate hikes and even more aggressive communication regarding its future path are making everyone nervous around the globe. Uncertainty about the future economic outlook has increased meaningfully and the financial system has become extremely fragile.
The major concern at this point is – for how long financial system can sustain this accelerated tightening without causing any major accident?
Currencies across developed and emerging markets have been falling sharply against the US Dollar. This makes everything from energy to debt servicing costlier for a large part of the world.
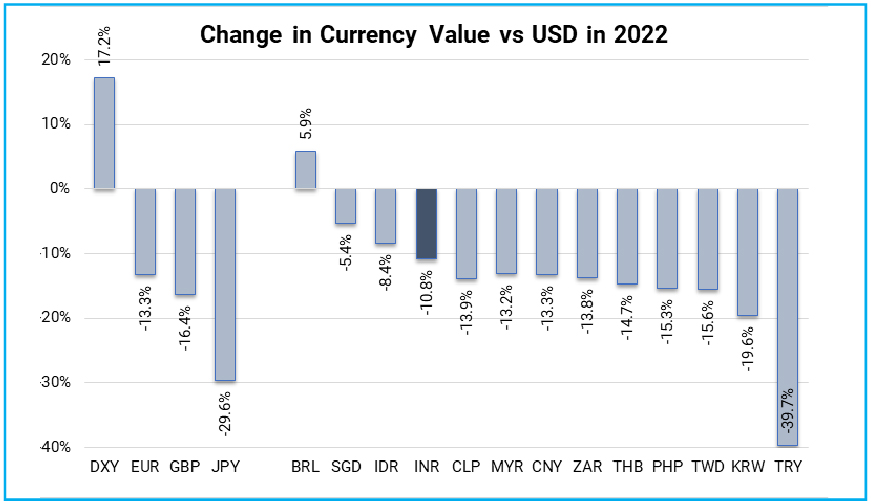
Source – Bloomberg, Quantum Research, Data as of October 18, 2022
Unlike previous crisis, this time hypocenter of market turbulence is in advanced economies. Emerging Market pack as whole has been relatively less impacted till now. But its vulnerability is increasing every passing day.
Investors have withdrawn more than USD 70 billion from emerging market debt funds so far in 2022. With soaring interest rates in the developed world, many emerging economies may find it difficult to rollover their external debt. At the same time, foreign exchange reserves are depleting fast.
Financial markets are edgy. Margin call on UK pension funds, trading freeze in Japanese government bonds, falling liquidity in the US treasury markets etc. are signs of brewing financial market crisis.
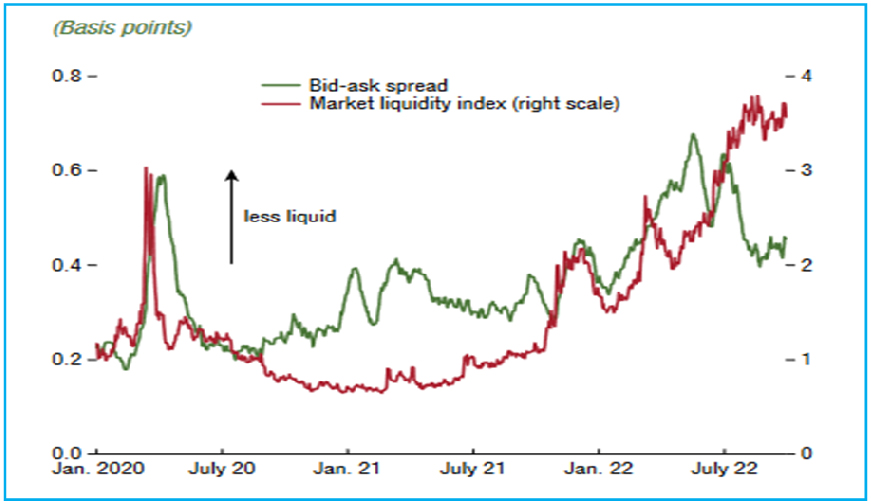
Source – IMF Global Financial Stability Report – October 2022
Can central banks ignore financial stability risk?
History suggests they can’t.
Financial markets can have serious effects on the functioning of the global economy. Worst of the economic crisis from the Great Depression of 1929-39 to the Great Recession of 2007-09, have emanated from financial market collapse.
“Regarding the Great Depression, … we did it. We’re very sorry. … We won’t do it again.”
—Ben Bernanke, November 8, 2002
Over the years, Financial Stability became an unsaid goal of every central bank more so for the US Federal Reserve. In the past decade, the fed intervened at every hint of market turbulence.
We are once again at a tipping point. Monetary policy works with a lag of 6-9 months. Impact of recent rate hikes and liquidity tightening may not be seen immediately. So, front loading rate hikes too much, will increase a risk of over doing.
In words of International Monetary Fund (IMF) - “The risk of monetary, fiscal, or financial policy miscalibration has risen sharply amid high uncertainty and growing fragilities”.
Given the elevated inflation, the FED would not be too sensitive to falling asset prices. Rather, they would like lower asset prices as it could help in lowering inflation momentum through negative wealth effect. But it would be difficult for them to ignore market dysfunctioning.
Even its inflation objective cannot be achieved without a support from the market. Turbulence in the financial markets can limit their ability to go after inflation by forcing it to readjust the monetary policy.
The biggest risk central banks face at this moment is that they may have to stop tightening before getting inflation under control. Thus, we may see financial stability discussion taking a centre stage in the policy setting going ahead.
A glimpse of this can be seen in UK where the Bank of England has to temporarily pause its quantitative tightening program and start buying bonds to stabilise the market.
In order to strike a balance between the two objectives of inflation and financial stability, the Fed will have to re-calibrate the pace of rate hikes and liquidity unwinding with due consideration to financial stability risks.
Where does India stand in all this?
In 2022 so far, the INR has fallen by 11.8% against US Dollar, from ~INR 74/USD at the start of the year to around INR 83/USD at the time of writing this report on October 19, 2022.
RBI’s Foreign exchange reserves have fallen by more than USD 100 billion over the last 12 months. As per the RBI, two third of this decline was due to revaluation of reserves maintained in other currencies, and the remaining one third of decline is due to sale of forex reserves by the RBI to protect the Rupee from falling too sharply.
As per the latest available data for October 7, 2022, RBI’s foreign exchange reserve stands at USD 532.8 billion. This still provides the RBI sufficient fire power to curtail sharp volatility in INR. Nevertheless, sustained rise in Dollar will continue to put pressure on the INR.
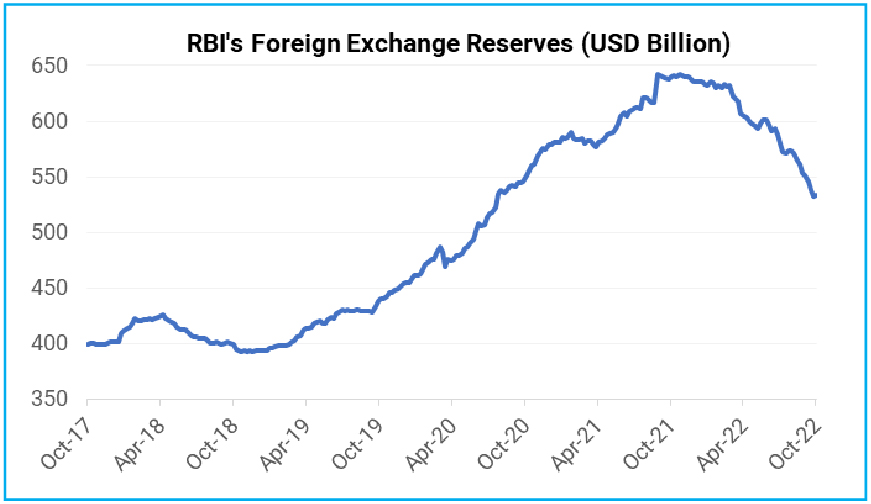
Source – RBI, Quantum Research, Data as of October 18, 2022
The monetary policy debate within the RBI has already shifted from inflation to external risks. Inflation, though still above the RBI’s upper threshold of 6%, is expected to come down gradually. But, a mix of high crude oil prices and wide current account deficit is making India vulnerable to global shock.
If Fed slows down, it would be a shy of relief for the RBI as well. It will allow the RBI to focus on domestic growth inflation dynamics.
From domestic macro stand point, the monetary policy cycle is nearing its peak. The RBI has frontloaded the monetary policy tightening with - (a) 190 basis points increase in the repo rate; (b) 230 basis points increase in the floor policy rate (Reverse Repo/SDF); and (c) reduction in core liquidity surplus by around Rs. 7 trillion.
Effective overnight rates represented by overnight Tri-Party Repo rate has increased by over 280 basis points from 3.25% at the start of the year to around 6.10% now.
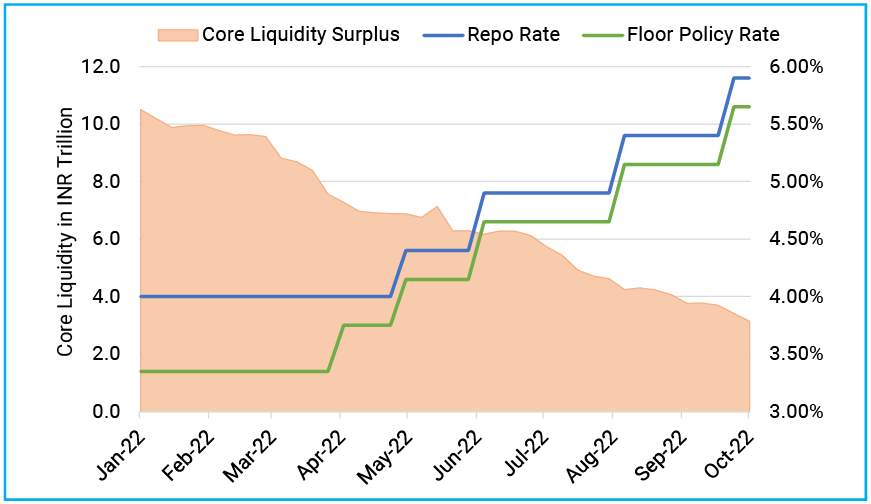
Source – RBI, Quantum Research, Data upto October 7, 2022
Impact of these rate hikes and liquidity tightening will be seen in the real economy over the next 3-4 quarters. In principle, monetary tightening should slowdown demand and put downward pressure on inflation.
Although Indian economy is recovering at a steady pace, it is still growing below its potential and remain well below the pre pandemic trend. Tightening global financial conditions and recessionary fears in advanced economies will also be drag on growth.
Given the significant frontloaded tightening in monetary policy and fragility of economic growth, there is a case for the RBI to slowdown or even pause.
Some of the monetary policy committee members also presented a case for the RBI to adopt a more calibrated approach going forward.
Dr. Ashima Goyal in her remarks mentioned - “If lagged effects of monetary policy are large, as in India, over-reaction can be very costly. Harmful effects become clear too late and are difficult to reverse.” She added “High uncertainty also calls for slow steps.”
Prof. Jayanth Verma said - “It is dangerous to push the policy rate well above the neutral rate in an environment where the growth outlook is very fragile.”
In our opinion, the RBI will be more data dependent and will likely slow down the pace of tightening. The Repo rate may peak somewhere between 6.0%-6.5%.
How will it affect the Indian bond market?
The bond market is already pricing for a terminal repo rate of 6.5%. So, another 25-50 basis points rate hike will not impact market prices in any material way.
Much of the macro worsening has already happened and it is now part of collective market psyche. We have already seen the worst of inflation. Much of rate hikes have already happened. The peak of central banks’ hawkishness is now behind us.
It is a time we should look beyond the market noises and spot the emerging trend.
After recent sell off, bond valuations have improved. Currently, the 3-5 years government bonds are trading at yield of between 7.30%-7.45%. This is more than 140 basis points above the repo rate of 5.9%. The long-term average of this spread in a tightening interest rate environment is around 80-90 basis points.
As the monetary policy stabilises, yield spread between long term bonds and the repo rate should compress. So, we see limited upside on yields from here.
Entire bond yield curve is now trading at a yield above the expected CPI inflation.
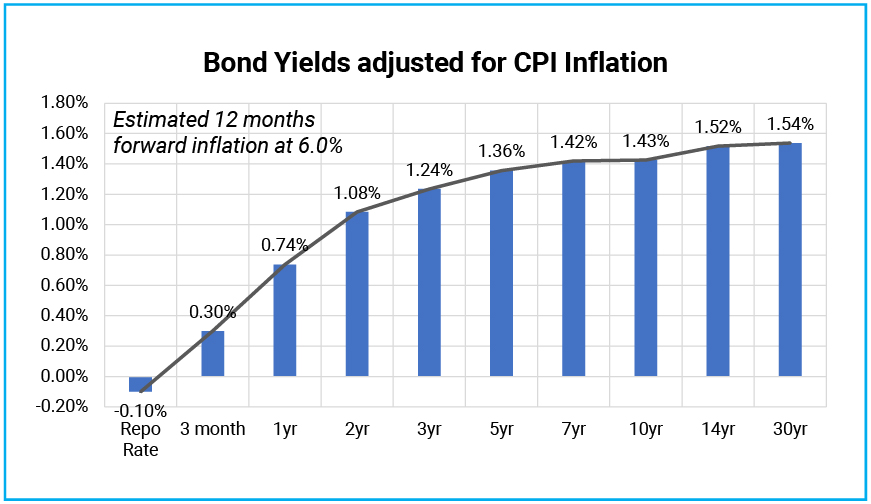
Source – Refinitiv, Quantum Research, Data as of October 18, 2022
We expect bond yields to move sideways in a tight range with the 10 year Gsec yield trading between 7.2%-7.6%. While Short term money market rates will move higher along with the policy repo rate.
Considering the duration-accrual balance, 3-5 year segment remains the best play as core portfolio allocation. However, valuation at the longer end bonds upto 10 year have also turned attractive after recent sell off.
What should Investors do?
We suggest investors with 2-3 years holding period should consider adding their allocation to dynamic bond funds.
Medium to Long term interest rates in the bond markets are already at long-term averages as compared to fixed deposits which remain low. With higher accrual yield (interest income) and relatively lower price risk (compared to the last two years), dynamic bond funds are appropriately positioned to gain over the next 2-3 years.
Dynamic bond funds have flexibility to change the portfolio positioning as per the evolving market conditions. This makes dynamic bond funds better suited for the long-term investors in this volatile macro environment than other long term bond fund categories.
Investors with shorter investment horizon and low risk appetite should stick with liquid funds. With increase in short term interest rates, we should expect further improvement in potential returns from investments in liquid going forward.
Since the interest rate on bank saving accounts are not likely to increase quickly while the returns from liquid fund are already seeing an increase, investing in liquid funds looks more attractive for your surplus funds.
Investors with a short-term investment horizon and with little desire to take risks, should invest in liquid funds which own government securities and do not invest in private sector companies which carry lower liquidity and higher risk of capital loss in case of default.
Portfolio Positioning
Scheme Name | Strategy |
Quantum Liquid Fund | The scheme continues to invest in debt securities of upto 91 days maturity issued by the government and selected public sector companies. |
Quantum Dynamic Bond Fund | The scheme continues to invest in debt securities issued by the government and selected public sector companies. The scheme follows an active duration management strategy. Based on our market outlook, we continue to prefer 3-5 year government bonds as a core allocation in the scheme. |
For any queries directly linked to the insights and data shared in the newsletter, please reach out to the author – Pankaj Pathak, Fund Manager – Fixed Income at [email protected].
For all other queries, please contact Neeraj Kotian – Area Manager, Quantum AMC at [email protected] / [email protected] or call him on Tel: 9833289034
Read our last few Debt Market Observer write-ups -
- Indian Bonds Going Global
- Let's Bond with Bonds
| Name of the Scheme | This product is suitable for investors who are seeking* | Riskometer |
| Quantum Liquid Fund An Open-ended Liquid Scheme. A relatively low interest rate risk and relatively low credit risk. | • Income over the short term • Investments in debt / money market instruments | 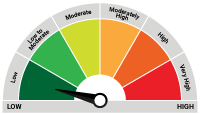 Investors understand that their principal will be at Low Risk |
| Quantum Dynamic Bond Fund An Open-ended Dynamic Debt Scheme Investing Across Duration. A relatively high interest rate risk and relatively low credit risk. | • Regular income over short to medium term and capital appreciation • Investment in Debt / Money Market Instruments / Government Securities | 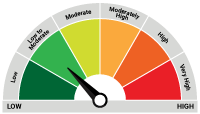 Investors understand that their principal will be at Low to Moderate Risk |
* Investors should consult their financial advisers if in doubt about whether the product is suitable for them.
The Risk Level of the Scheme in the Risk O Meter is based on the portfolio of the scheme as on September 30, 2022.
| Potential Risk Class Matrix – Quantum Dynamic Bond Fund | |||
| Credit Risk → | Relatively Low | Moderate (Class B) | Relatively High (Class C) |
| Interest Rate Risk↓ | |||
| Relatively Low (Class I) | |||
| Moderate (Class II) | |||
| Relatively High (Class III) | A-III | ||
| Potential Risk Class Matrix – Quantum Liquid Fund | |||
| Credit Risk → | Relatively Low | Moderate (Class B) | Relatively High (Class C) |
| Interest Rate Risk↓ | |||
| Relatively Low (Class I) | A-I | ||
| Moderate (Class II) | |||
| Relatively High (Class III) | |||
Disclaimer, Statutory Details & Risk Factors:
The views expressed here in this article / video are for general information and reading purpose only and do not constitute any guidelines and recommendations on any course of action to be followed by the reader. Quantum AMC / Quantum Mutual Fund is not guaranteeing / offering / communicating any indicative yield on investments made in the scheme(s). The views are not meant to serve as a professional guide / investment advice / intended to be an offer or solicitation for the purchase or sale of any financial product or instrument or mutual fund units for the reader. The article has been prepared on the basis of publicly available information, internally developed data and other sources believed to be reliable. Whilst no action has been solicited based upon the information provided herein, due care has been taken to ensure that the facts are accurate and views given are fair and reasonable as on date. Readers of this article should rely on information/data arising out of their own investigations and advised to seek independent professional advice and arrive at an informed decision before making any investments.
Mutual fund investments are subject to market risks read all scheme related documents carefully.
Please visit – www.quantumamc.com/disclaimer to read scheme specific risk factors. Investors in the Scheme(s) are not being offered a guaranteed or assured rate of return and there can be no assurance that the schemes objective will be achieved and the NAV of the scheme(s) may go up and down depending upon the factors and forces affecting securities market. Investment in mutual fund units involves investment risk such as trading volumes, settlement risk, liquidity risk, default risk including possible loss of capital. Past performance of the sponsor / AMC / Mutual Fund does not indicate the future performance of the Scheme(s). Statutory Details: Quantum Mutual Fund (the Fund) has been constituted as a Trust under the Indian Trusts Act, 1882. Sponsor: Quantum Advisors Private Limited. (liability of Sponsor limited to Rs. 1,00,000/-) Trustee: Quantum Trustee Company Private Limited. Investment Manager: Quantum Asset Management Company Private Limited. The Sponsor, Trustee and Investment Manager are incorporated under the Companies Act, 1956.
Related Posts
-

The Pivot
Posted On Friday, Apr 21, 2023
The fiscal year 2022-23 has come to an end. The defining feature
Read More -

Yield Curve Inversion Ahead
Posted On Thursday, Mar 23, 2023
Indian money markets have tightened meaningfully over the last one and a half month.
Read More -

Past, Present, and Future of Inflation
Posted On Friday, Feb 24, 2023
Inflation has been one of the biggest challenges in the post-pandemic world.
Read More


