What is NAV and How Does it Affect Your Mutual Fund Returns?
Posted On Friday, Mar 11, 2016
The market (S&P BSE Sensex) is down 316 points today. Good time for mutual fund investors to invest in equities!
So, why do investors invest in the market through mutual funds, in the first place?
In order to get decent returns and participate in the India growth story...
To ensure that their savings are managed by professional fund managers...
To be more ‘relaxed’ about investments always and not chew their nails over trying to time the market... could come up with a million reasons here ☺
The idea of this article, however, is not to tell you why to invest, but to tell you what happens immediately after you invest. As you complete the transaction, what does the fund house machinery process, and what is the final output... That final output, what you get from the Fund House after your investments, is called Units.
The number of units you get after you complete your investment depends on something called an NAV, and how the NAV moves dictates returns on your investment.
NAV stands for Net Asset Value and is the price of a unit of the scheme on a given date. NAV is the single most important number for a mutual fund scheme because all transactions of a fund are with reference to NAV.
NAV, which reflects the worth of each unit of a scheme, is computed and declared by mutual fund AMCs on all business days. Depending on the type of scheme, NAV is calculated up to 2 or 4 decimal places.
So, how does the fund house calculate NAV?
On subtracting liabilities of a scheme from its total assets what remains is the net asset. Assets for a mutual fund scheme are the market value of securities and receivables in its portfolio and its cash balances. Liabilities refer to expenses and payables the scheme must pay in the process of operations. Thus
| Net asset = Total assets - Liabilities |
Net asset value is calculated by dividing net assets by the total number of units of a scheme. Units are added to the scheme when investors invest in the scheme and are reduced when investors redeem units. So you have
| Net asset value = (Total assets - Liabilities)/No of units |
All three of the above variables viz total assets, liabilities and number of units can change in values daily and that’s the reason why a scheme’s NAV changes on a daily basis.
Like we had that scholar kid in school, whom we just had to beat or match in the exam; all mutual fund schemes have a benchmark index which the fund manager attempts to match (in case of passively managed funds like ETFs) or beat (in case of actively managed funds like diversified equity funds).
In the case of the Quantum Long Term Equity Fund, the benchmark is the S&P BSE 30 Total Return Index (TRI). The benchmark is calculated on a "Market Capitalization-Weighted" methodology of 30 component stocks representing large, well-established and financially sound companies across key sectors. We chose this benchmark since it appropriately represents the returns from the S&P BSE 30 Sensex as this benchmark includes the dividend received from the S&P BSE 30 companies, thereby the 30TRI “line” will always be higher than the S&P BSE Sensex and therefore be that much harder to beat - yes we do set the bar higher for ourselves! ☺
Can there be variation in benchmark and the fund’s NAV?
The myth that we, as asset managers often face, is that the NAV of a fund and the level of the underlying market both are positively correlated (shocking is the level of jargon we get used to in the financial world! – what is meant by positively correlated is that if the markets rise, it is a given that the NAV of the fund WILL rise).
The fact, however, is that this is not necessarily true! Here’s why:
To understand the concept better, let us take you back to mathematics 2.0 - to the Set theory. Basically when you compare the fund’s NAV to the returns of the stock market, it’s like a set, sub-set relationship. The larger set being the market and the smaller one being the fund.
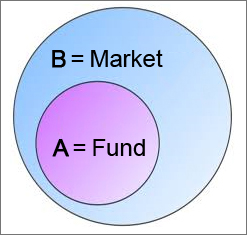
Keep this at the back of your mind, dear reader and you will find that there can be the following outcomes in this relationship:
The NAV and the markets rise/fall together by the same degree
The stocks that have driven the market up/down are the stocks in the portfolio of the fund, in the same proportion; therefore the corresponding rise/fall of the market and the NAV of the fund seem almost concurrent.
The market rises but the NAV does not rise by the same degree
The stocks that have driven the market up may not be present in the portfolio of the fund; therefore the market rises higher than the NAV of the fund for that particular day. It could also be that the stocks are present in the portfolio but at a much lower percentage as compared to the market.
The NAV rises but the markets do not rise by the same degree
It could also be that the fund may hold stocks that have pushed the market up in higher proportion, as a percentage of the portfolio as compared to the market; hence the NAV of the fund is higher than market levels. This tends to work in situations where the markets go down more that the stocks that have driven the markets south are either not present in the portfolio or are present at a much lower percentage as compared to the market.
The market falls but the NAV falls further south or may even rise!
This is again a very probable situation where the market falls by let’s say 1% but the fund plunges by 2%. In this case what could have happened is that the stocks that have driven the market south are the only ones present in the fund and therefore caused maximum harm to its portfolio. Also the stocks responsible for the plunge were present in a greater percentage as part of the portfolio as compared to the markets.
Another scenario that emerges from this is that the stocks that drove the markets south, may not be a part of the fund’s portfolio and that’s when the NAV of the fund could be positive, while the stock market levels go south.
A Live Example
Let us explain this further with an example of Quantum Long Term Equity Fund – QLTEF
Our flagship fund QLTEF’s main aim is to invest in high quality companies with sound management and right valuations. While the market environment may affect the composition of the portfolio of the fund, we tend to ignore short term trends and ride their impact on our portfolio. With bottom up stock selection process and a qualified team of analysts we follow the value style of investing where we pick stocks not only on the basis of the numbers in the balance sheet, but also the softer aspects like the quality of the senior management and their ability to visualize the shape of their business in the near and distant future and their ability to cope with hiccups along the way.
Quantum’s research and investment team employs the following process to create and manage QLTEF’s portfolio. Stocks selected has to be under active coverage, average daily trading volume of US$1 million (usually large caps stocks, hence more liquid and less volatile). The AMC’s stock selection approach is basically bottom up and is depicted below:
|
The NAV for QLTEF -
The NAV for the fund is calculated using clarity market price as per NSE, by Deutsche Bank, our custodian and published by them in AMFI and across several publications.
This table shows the comparison of the NAV of the Quantum Long Term Equity Fund on 30 July and 31 July, 2015 vis-à-vis the benchmark i.e. S&P BSE 30 TRI. On 31st July, 2015 the markets went up by 1.48% as compared to the previous business day 30th July, 2015 but the NAV of the fund went up only by 0.49%. This reflects what we stated earlier in scenario 2, where we say that the market may rise but the NAV need not rise by the same degree.
| 30-Jul-2015 | 31-Jul-2015 | % change in a day | |
| QLTEF NAV | 38.85 | 39.04 | 0.49% |
| BSE 30 TRI | 38,300.84 | 38,866.54 | 1.48% |
PAST PERFORMANCE MAY OR MAY NOT BE SUSTAINED IN FUTURE. THE INTENT HERE IS NOT TO SHOW THE PERFORMANCE BUT TO DISPLAY THE DIFFERNCE BETWEEN QLTEF NAV AND MARKET VALUE
Note: We have considered the NAV for 31st July, 2015 because the difference between QLTEF NAV and market value is significant. To know stocks wise differences refer annexure 1a & 1b below.
The NAV calculated are also audited by third party auditors who verify the veracity of the NAV, hence the thought that comes across the minds of redeeming investors that the NAV seems to be down whenever they redeem seems ludicrous, since there is no guarantee that the NAV and its benchmark go in tandem always.
With our constant focus on doing what is right for our investors, we at Quantum have always pledged to follow and adhere to norms and processes that will ensure complete transparency. Our aim is to be not the largest fund house, but India’s most respected fund house. That is possible by focusing on the needs of our investors.
Moreover, we would encourage you to write to us at [email protected] in case there are any such doubts in your mind. It would be an honor to get back to you and clear the air.
Annexure 1a
The reason for the difference in performance of the NAV of QLTEF and the benchmark – S&P BSE 30 TRI is given in the two tables below. There are two reasons for the same:
Reason 1 – the stocks that drove the performance levels of the market upwards were not present in the portfolio. A table of those stocks is given below for your reference. This is a table of the scripts from BSE 30 TRI Benchmark which moved up substantially but is not part of QLTEF Portfolio on 31st July, 2015.
| Scrip Name | Closing Price (BSE) 30/07/2015 | Closing Price (BSE) 31/07/2015 | % Weightage in BSE 30 TRI | % Gain for the day |
| Coal India Ltd | 420.20 | 439.30 | 2.25% | 4.55% |
| Lupin Ltd | 1,626.40 | 1,695.65 | 1.64% | 4.26% |
| Dr Reddy`s Laboratories Ltd | 3,907.55 | 4,065.70 | 2.10% | 4.05% |
| ICICI Bank Ltd | 290.95 | 302.50 | 7.10% | 3.97% |
| Mahindra & Mahindra Ltd | 1,316.75 | 1,361.60 | 2.53% | 3.41% |
| ITC Ltd | 315.80 | 326.20 | 7.41% | 3.29% |
| Wipro Ltd | 561.15 | 569.15 | 1.54% | 1.43% |
| Axis Bank Ltd | 565.95 | 573.75 | 3.91% | 1.38% |
Annexure 1b
Reason 2 – The stocks that were a part of the QLTEF portfolio did badly on that day. Therefore not only did the portfolio not have the stocks that would have driven the NAV as high as the market, but also had the stocks given in the table below which did not perform well on that day. Here is a list of the scrips from QLTEF portfolio which fell sharply but are not part of BSE 30 TRI Benchmark on 31st July, 2015.
| Scrip Name | Closing Price (NSE) 30/07/2015 | Closing Price (NSE) 31/07/2015 | % Weightage in Portfolio | % fall for the day |
| Indian Oil Corporation Ltd | 445.90 | 431.35 | 3.96% | -3.26% |
| Tata Chemicals Ltd | 506.35 | 490.00 | 3.99% | -3.23% |
| Kotak Mahindra Bank Ltd | 716.80 | 695.40 | 3.72% | -2.99% |
| The Indian Hotels Company Ltd | 86.00 | 85.01 | 0.54% | -1.15% |
Taking an example from the two tables QLTEF did not have Coal India, scrip which drove the market up, but had IOCL, which did not do well and brought the NAV down.
Therefore there is no guarantee that a rise in market levels is always equal to the rise in NAV.
Product Labeling
| Name of the Scheme & Primary Benchmark | This product is suitable for investors who are seeking* | Risk-o-meter of Scheme |
| Quantum Long Term Equity Value Fund An Open Ended Equity Scheme following a Value Investment Strategy | • Long term capital appreciation • Invests primarily in equity and equity related securities of companies in S&P BSE 200 index. | 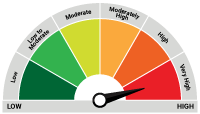 Investors understand that their principal will be at Moderate Risk |
* Investors should consult their financial advisers if in doubt about whether the product is suitable for them.
Disclaimer, Statutory Details & Risk Factors:
The views expressed here in this article / video are for general information and reading purpose only and do not constitute any guidelines and recommendations on any course of action to be followed by the reader. Quantum AMC / Quantum Mutual Fund is not guaranteeing / offering / communicating any indicative yield on investments made in the scheme(s). The views are not meant to serve as a professional guide / investment advice / intended to be an offer or solicitation for the purchase or sale of any financial product or instrument or mutual fund units for the reader. The article has been prepared on the basis of publicly available information, internally developed data and other sources believed to be reliable. Whilst no action has been solicited based upon the information provided herein, due care has been taken to ensure that the facts are accurate and views given are fair and reasonable as on date. Readers of this article should rely on information/data arising out of their own investigations and advised to seek independent professional advice and arrive at an informed decision before making any investments.
Mutual fund investments are subject to market risks read all scheme related documents carefully.
Please visit – www.QuantumMF.com to read scheme specific risk factors. Investors in the Scheme(s) are not being offered a guaranteed or assured rate of return and there can be no assurance that the schemes objective will be achieved and the NAV of the scheme(s) may go up and down depending upon the factors and forces affecting securities market. Investment in mutual fund units involves investment risk such as trading volumes, settlement risk, liquidity risk, default risk including possible loss of capital. Past performance of the sponsor / AMC / Mutual Fund does not indicate the future performance of the Scheme(s). Statutory Details: Quantum Mutual Fund (the Fund) has been constituted as a Trust under the Indian Trusts Act, 1882. Sponsor: Quantum Advisors Private Limited. (liability of Sponsor limited to Rs. 1,00,000/-) Trustee: Quantum Trustee Company Private Limited. Investment Manager: Quantum Asset Management Company Private Limited. The Sponsor, Trustee and Investment Manager are incorporated under the Companies Act, 1956.
View All
Related Posts
-

Equity Outlook - July 2026
Posted On Wednesday, Jul 01, 2026
Indian equities recovered in the month of June, as the West Asia crisis showed signs of de-escalation.
Read More -

Debt Outlook - July 2026
Posted On Wednesday, Jul 01, 2026
The Indian fixed income market enters the second half of FY27 with a macro backdrop that is becoming increasingly supportive for bonds, even as inflation risks remain on the horizon.
Read More -

Gold Outlook - July 2026
Posted On Wednesday, Jul 01, 2026
June closed out with gold breaching the $4,000/oz1 mark for the first time since November 2025. The move capped a reversal that built steadily through June, standing in sharp contrast to May's far quieter tone.
Read More

