An Early Diwali for Bond Markets
Posted On Friday, Oct 16, 2020
Governor Das’s policy announcements in support of the bond markets in March 2020 were termed as a bazooka. The announcements in the October monetary policy for the bond markets have enough to light up a few fireworks as well.
Past Performance May or May not sustained in Future
Last month, we spoke of the Das PUT – the expectation of RBI supporting the bond market whenever bond yields move up.
The Das PUT was visible with the RBI announcing OMOs, Twists, HTM relaxation to cap bond yields. They also tried the non-monetary signalling route by devolving the 10-year bond auction on underwriters thereby showcasing its displeasure to the level of the 10-year bond yield.
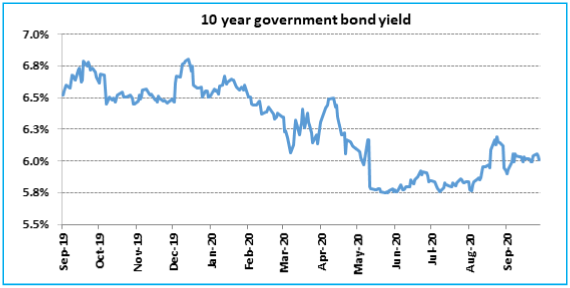
The 10-year benchmark bond yield had moved up sharply after the August monetary policy from the levels of ~5.8% to ~6.2%. RBI’s supportive measures have brought it down to about 5.9% now.
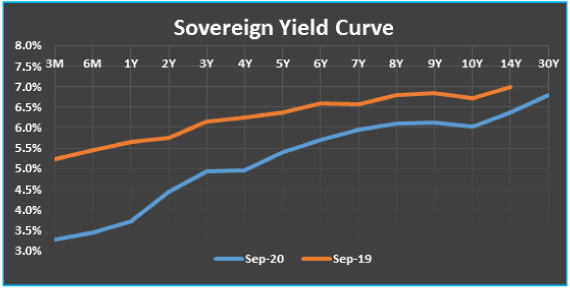
In the face of continued government bond supply and its uncertainty on the extent of the centre and state fiscal deficit, the longer end of the bond yield has remained high. The RBI is now moving its attention to try and address the yield curve. The Reverse repo rate is at 3.35%, the 5-year government bond is at 5.2%, the 10-year government bond is at 6.0% and the 30-year bond is at 6.8%. This as they call is a steep yield curve.
Orderly Yield Curve is a Public Good
With inflation well above its higher range of 6%, there isn’t scope to cut the policy repo and reverse repo rate. The RBI now has to use market instruments and moral suasion to get bond yields lower.
As per market demands, they have doubled the size of Open Market Operation (OMOs) to Rs. 200 billion per week. The RBI had been conducting operation twist/OMO of Rs. 100 billion every week since August 27, 2020.
Past Performance May or May not sustained in Future
Continuing its unprecedented actions, it has now announced OMOs in State Development Bonds. This is the first time, the RBI will manage the liquidity and the yields in the Quasi-Sovereign Space. Indian State finances are in an even dire situation than the Centre. However, States are at the frontline of the fight against COVID and to manage the economic recovery. States, having given up its rights on taxes after the introduction of the GST are now dependent on the Centre to provide them with the compensation of the loss in tax revenues. Anticipating the large increase in state government borrowing, the RBI is stepping into through OMOs to drive demand into the SDLs.
They have also used an age old monetary policy tool – Moral Suasion – asking market participants to believe in the RBI and support the government’s market borrowing and to not get into a combative mood.
“Financial Stability and orderly evolution of the Yield curve is a public Good” – the governor remarked.
| Dec-18 till Feb-20 | Mar 20 till Oct 20 | |
| Rate Cuts | Cut the Repo Rate by 135 bps (1.35%) from 6.5% to 5.15% from Oct 2018 till Feb 2020 | Cut Repo rate by 115 bps (1.15%) to 4.0% and Reverse Repo rate by 155 bps to 3.35%. |
| Move System Liquidity from Deficit to Surplus | ● OMOs of ~INR 3.1 trillion ● FX USD/INR Buy/Sell Swap of USD 10 bln ● Outright FX purchase of USD 70 Bln (~ INR 4.9 trillion) | Cash Reserve Ratio cut by 100 basis points of NDTL (~INR 1.4 trillion) Change in LCR Ratios Liquidity Surplus at INR 4 trillion |
| Manage long term bond yields | Conducted Operation Twists worth INR 400 bn whereby the RBI bought long term bonds and sold short maturity bonds | OMOs of INR 700 bn Operation Twist of INR 700 bn Buying T-Bills under auction, Indirect monetization Large increase in Government’s overdraft facilities Increased HTM limit for Banks from 19.5% to 22% of NDTL Commitment to conduct OMOs/Operation twist whenever needed Increased the size of weekly OMOs |
| Drive through Monetary Transmission | Long Term Repo Operations (LTRO) by providing banks with 1 and 3 year upto INR 1 trillion at a fixed rate | Targeted-LTRO of INR 1.5 trillion for buying corporate bonds & Commercial papers On-tap TLTROs for onward lending to specified sectors |
The markets, for now should respond favourably and bond yields across government bonds, State developments bonds and high rated corporate bonds should fall. Bond yield spreads between Government and State governments can narrow from its current levels.
Low for Long?
Governor Das’s ‘whatever it takes’ comment to support growth was likened to Mario Draghi, the ECB chairman’s similar refrain in 2012 to support the Euro.
The RBI has extended its “accommodative stance of monetary policy as long as necessary – at least during the current financial year and into the next year”.
The US FED gives out such guidance by saying – ‘Low for Long’ – that interest rates will remain low for long.
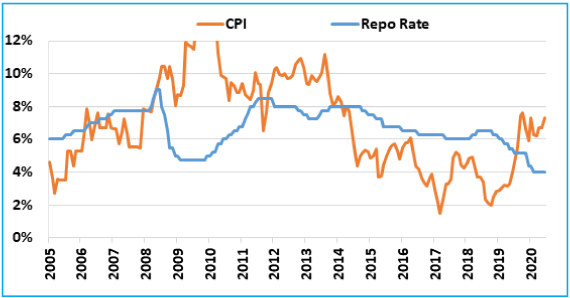
The RBI is attempting to give a longer guidance to the banks and the economy that they will keep interest rates low and maintain excess liquidity. This is however subject to CPI inflation. If inflation remains stubborn (see 2009-2011 period in chart below), the MPC may have to tighten liquidity and hike rates.
What is Normal?
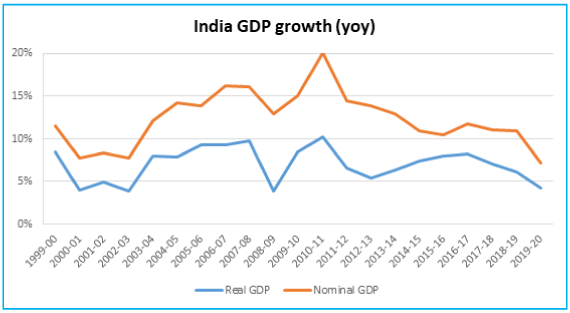
India entered COVID with below 5% GDP growth. When we talk about normalized GDP growth, what does it mean? 5%? 6%? 7%?
This Low for long on interest rates then depends on what RBI estimates normalized growth to be.
At Quantum, we estimate GDP growth for FY 22-25 to be well below its long-term potential of 6.5%. So, may be in a situation of low growth and higher than wanted inflation. This scenario will have implications for the bond market the economy.
Tactical or Structural Trade
When the 10-year government bond yield moved below the 6% mark, we changed our bond market allocation outlook to tactical. We noted that Indian bond yields do not sustain below 6% for long.
We had also suggested investors to lower their return expectations from fixed income – as money market yields, fixed deposits will remain low and potential capital gains from long bond funds will be muted.
In our opinion, at this juncture investors should prefer dynamic bond funds over long duration bond funds. In Dynamic Bond Funds, fund managers have flexibility to change the portfolio duration (sensitivity of portfolio to interest rate movement) when their outlook on interest rate changes.
Past Performance May or May not sustained in Future
Because of the Das PUT, there may be tactical opportunities to trade in a range, which we also did when 10-year bond yields went towards 6.2%.
The RBI’s continued actions indicate their desire to see the 10-year bond yield even lower. We continue to see it as tactical trade opportunity in a broader range.
Why interest rates do not remain low for long in India?
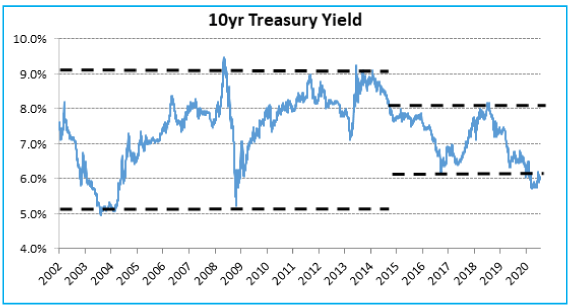
Indian bond yields are at historic lows. Indian interest rates are near all-time lows. If you look at the 20-year chart of the Indian 10-year bond yield, the levels below 6% do not sustain for too long. The average during this period is 7.57%. This chart is also volatile and broadly ranges between 5% and 9%.
Between 2015 and 2019, when India followed Inflation targeting, the 10-year bond ranged between 6% and 8%.
In 2004 and 2009 look at the rise in yields once the bond yields touched all-time lows of about 5% yield. The yield rise in both cases was all the way up to 9% over a 4-year period. Such large up move in yields were negative for the bond returns on both the occasions.
| Period | Yield move (10 year government Bond) | Daily Average 10 year Gsec Yield | Annualized Bond Fund Return | ||
| Crisil Composite Bond Fund Index | Crisil Short Term Bond Fund Index | Crisil Liquid Fund Index | |||
| Oct 2003 - July 2008 | From 5.1% to 9.3% | 7.1% | 3.3% | 5.1% | 5.7% |
| Dec 2008 - Oct 2011 | From 5.2% to 8.9% | 7.6% | 4.8% | 6.2% | 5.9% |
Table shows the annualized returns of debt fund indices during the rising yield cycles of 2003-2008 and 2008-2011. Data are taken on monthly closing basis to calculate the returns. This is shown only for illustration purpose.
Past Performance May or May not sustained in Future
2004-2008: the yield rise was primarily driven by higher growth and followed by a very late cycle inflation.
Overall a good outcome, as an asset allocation shift to equities would have managed the lower returns from fixed income.
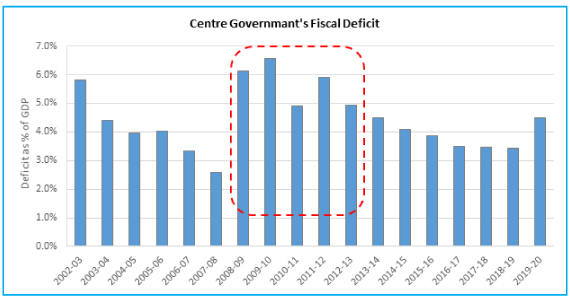
2009-2013: the initial rise in yields was purely an outcome of the increase in fiscal deficit. The centre’s fiscal deficit exploded from 3% of GDP to 6%; while at the same time RBI had to catch up to the very high CPI inflation by aggressive rate hikes.
A bad outcome as fixed income returns fell, equities didn’t do well and we eventually ended up with a currency crisis.
We are not saying that this time will be the same. But it is important to understand the investing risks if it so happens. Also, it is important to understand what factors then drove the bond yields higher.
Fiscal Situation
In the current scenario, we have a large increase in fiscal deficit as the government responds to the economic impact of COVID-19. The trouble is that the fiscal deficit may stay high in FY 2022 as well.
| Government Market Borrowings | ||||
| (INR Trillion) | FY19 | FY20 | FY21E | FY22E |
| Centre | 5.7 | 7.1 | 14.1 | 10.9 |
| States | 4.8 | 6.4 | 8.1 | 8.0 |
| Total | 10.5 | 13.5 | 22.2 | 18.9 |
| % of GDP | 5.5% | 6.6% | 11.3% | 8.6% |
FY21 and FY22 borrowing numbers are as per Quantum Estimates
This year, the lack of growth and the risk aversion, has meant that banks have excess cash to buy government bonds. The bond market will face high supply of bonds next year at a time when the liquidity and credit conditions might not be as supportive. This could lead to higher longer tenor bond yields going ahead.
Don’t see a deep bond rally
The increase in our portfolio risk and maturity in the Quantum Dynamic Bond Fund is thus a tactical move. We are positioning for the Das PUT and the resultant stealth softening of bond yields. Given the objective of our fund stated in the name itself – we retain our right to remain dynamic in our portfolio construction as we though remain cognizant of these risks on the horizon.
We understand the economy and markets are currently adjusting to an unprecedented shock. There are too many moving parts and things are still evolving. Thus any forecast about future is susceptible to change based on policy responses from the government and the RBI and the changes in global markets. We stand vigilant to review our outlook as and when new information comes. Nevertheless, it would be prudent for investors to be conservative at times of heightened uncertainty.
Credit Crisis is not over yet
We reiterate our view that the credit crisis in the bond market is not over yet. The Indian economy has faced a severe jolt due to national lockdown. This has significantly weakened the debt servicing capacity of many companies and individuals. This could create a negative spiral in the economy and hence in the loan and bond markets. We may see risk of a higher amount of rating downgrades and defaults in the next two years.
In this scenario it would be prudent for investors to avoid excessive credit risk in their India debt exposure.
Editor's Note: For any further queries you can write to us at [email protected] / [email protected]. or call us on Tel: 9870458160 / 8689961495
| Name of the Scheme | This product is suitable for investors who are seeking* | Riskometer |
| Quantum Dynamic Bond Fund (An Open Ended Dynamic Debt Scheme Investing Across Duration) | • Regular income over short to medium term and capital appreciation • Investment in Debt / Money Market Instruments / Government Securities | 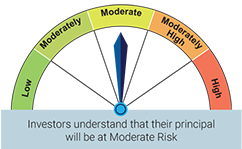 |
* Investors should consult their financial advisers if in doubt about whether the product is suitable for them.
Disclaimer, Statutory Details & Risk Factors:
The views expressed here in this article / video are for general information and reading purpose only and do not constitute any guidelines and recommendations on any course of action to be followed by the reader. Quantum AMC / Quantum Mutual Fund is not guaranteeing / offering / communicating any indicative yield on investments made in the scheme(s). The views are not meant to serve as a professional guide / investment advice / intended to be an offer or solicitation for the purchase or sale of any financial product or instrument or mutual fund units for the reader. The article has been prepared on the basis of publicly available information, internally developed data and other sources believed to be reliable. Whilst no action has been solicited based upon the information provided herein, due care has been taken to ensure that the facts are accurate and views given are fair and reasonable as on date. Readers of this article should rely on information/data arising out of their own investigations and advised to seek independent professional advice and arrive at an informed decision before making any investments.
Mutual fund investments are subject to market risks read all scheme related documents carefully.
Please visit – www.quantumamc.com/disclaimer to read scheme specific risk factors. Investors in the Scheme(s) are not being offered a guaranteed or assured rate of return and there can be no assurance that the schemes objective will be achieved and the NAV of the scheme(s) may go up and down depending upon the factors and forces affecting securities market. Investment in mutual fund units involves investment risk such as trading volumes, settlement risk, liquidity risk, default risk including possible loss of capital. Past performance of the sponsor / AMC / Mutual Fund does not indicate the future performance of the Scheme(s). Statutory Details: Quantum Mutual Fund (the Fund) has been constituted as a Trust under the Indian Trusts Act, 1882. Sponsor: Quantum Advisors Private Limited. (liability of Sponsor limited to Rs. 1,00,000/-) Trustee: Quantum Trustee Company Private Limited. Investment Manager: Quantum Asset Management Company Private Limited. The Sponsor, Trustee and Investment Manager are incorporated under the Companies Act, 1956.
View All
Related Posts
-

The Index of Services Production
Posted On Tuesday, Jul 28, 2026
Every month, India publishes a number for how much steel, cement, and electricity the economy produced via IIP (Index of Industrial Production).
Read More -

Equity Outlook - July 2026
Posted On Wednesday, Jul 01, 2026
Indian equities recovered in the month of June, as the West Asia crisis showed signs of de-escalation.
Read More -

Debt Outlook - July 2026
Posted On Wednesday, Jul 01, 2026
The Indian fixed income market enters the second half of FY27 with a macro backdrop that is becoming increasingly supportive for bonds, even as inflation risks remain on the horizon.
Read More

