Reluctant Normalisation
Posted On Thursday, Sep 23, 2021
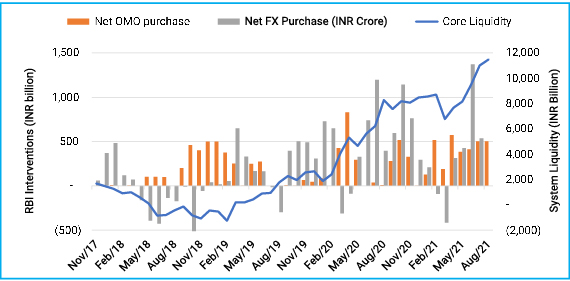
Liquidity surplus in the Indian banking system surged to a new historic peak at over Rs. 11 trillion in September 2021. This is ~7.4% of the total deposits of the Indian banking system. Even though liquidity condition has been in large surplus for the most part of last two years, the rise in surplus witnessed during the last three months is sizeable.
This is a direct consequence of RBI’s bond and foreign exchange purchases to keep bond yields low and to limit INR appreciation respectively. Since April 2021, the RBI has added durable liquidity of Rs. 3.2 trillion (~USD 43 bn) through foreign exchange buying and Rs. 2.4 trillion through the purchase of government bonds.
Chart – I: RBI flooded the market with liquidity
Source: RBI, Bloomberg, Quantum Research | Data up to August 2021
Reluctant Normalization
The RBI started the process of normalizing its liquidity operations in January 2021 with an introduction of a variable rate term reverse repos (VRRRs) for Rs. 2 trillion. In August 2021, it doubled the size of VRRR auctions to Rs. 4 trillion. It also added Rs. 1 trillion of 7 days VRRR out of monetary policy on September 13, 2021.
Based on the current outstanding position, the RBI has sucked out Rs. 3.5 trillion of excess liquidity for 15 days period and an additional Rs. 1.5 trillion for a period of 7 days under three separate VRRR operations.
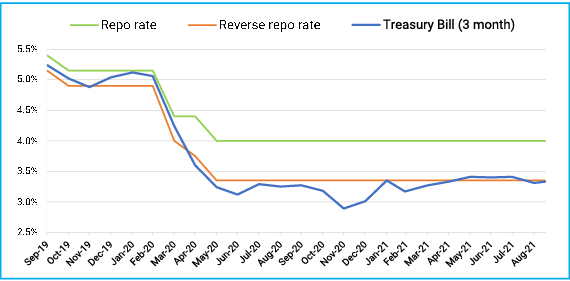
These are temporary liquidity absorption measures to set a floor on money market rates that have been persistently below the reverse repo rate – the ‘perceived floor rate’. It has no meaningful impact on the quantum of durable liquidity which is significantly higher than what is being absorbed through VRRRs.
As a consequence, weighted average call rate and short-term treasury bills rates continue to remain below the reverse repo rate of 3.35%. Increased liquidity surplus has also pulled down short-term bond yields. Since July 2021, the 3 months treasury bill rate has come down from ~3.45% to 3.28%, and the 2-year government bond yield has come down from 4.46% to 4.30% on September 15, 2021.
Chart – II: Excess Liquidity Keeping Short Term Rates suppressed
Source: RBI, Bloomberg, Quantum Research | Data Upto August 2021
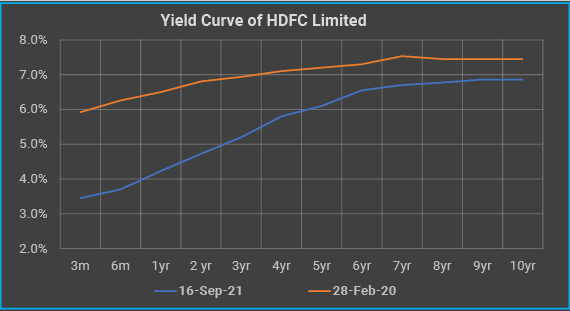
Ample liquidity has also helped businesses and the broader economy by way of easing access to credit and lowering the cost of capital. For an AAA-rated borrower like HDFC, the cost of a 3-month commercial paper is about 250 basis points lower than what it was in February 2020. Even the 3-year bond yield has come down about 170 basis points during this period. This is a substantial saving for any business and the result of this stimulus can be seen in the faster recovery from the once in a lifetime pandemic shock.
Any attempt to suck out the liquidity could put upward pressure on the cost of funds for the government and corporates and could jeopardize the ongoing growth recovery.
Chart – III: Ample Liquidity Lowered Cost of Fund for Companies
Source: Bloomberg, Crisil Valuation, Quantum Research | Data as of September 16, 2021
#The yield HDFC Ltd is used as a proxy for AAA-rated corporate bonds to illustrate the yield movement in the corporate bond segment. The yield curve is built by the Quantum Fixed Income Team using day-end bond valuation as provided by Crisil*.
Apparently, the RBI is not overly worried about the persistence of a high liquidity surplus. In a media interview, the RBI governor Shaktikanta Das stated that ‘there is no evidence of high liquidity and resultant high asset prices feeding into general inflation’.
Dr. Ashima Goyal, a member of the monetary policy committee in her MPC statement noted that that “India is subject to large negative liquidity shocks from the rise in currency holding, government cash balances, and foreign capital outflows”.
She also referred to the monetary policy normalization pursued by the US Federal Reserve during 2014-15 – “the US Fed stopped balance sheet expansion…but did not reverse its size—this worked well in keeping markets calm after the taper-on shock and in helping recovery”.
Although the MPC doesn’t directly vote on liquidity stance, it is evident that the RBI’s thinking has been on similar lines that of Dr. Ashima Goyal. This explains the RBI’s reluctance to deploy any durable liquidity absorption tool at this juncture. Rather they are willing to wait and allow natural liquidity drainers like cash withdrawals, foreign capital outflows, etc. to work over a period.
Road Ahead
Demand for cash tends to increase in the second half of the fiscal year due to the festive season and relatively higher economic activity towards year-end. Based on the past trend, cash withdrawal from the banking system during October 2021-March 2022 is estimated to be around Rs. 2.5 trillion. Even if we assume the RBI will stop its bonds and foreign exchange buying altogether, the core liquidity surplus will still remain above Rs. 8 trillion in the rest of FY22. This will be substantially higher than the core liquidity surplus available during the peak of the crisis last year.
The RBI under governor Das has adopted ‘an orderly evolution of yield curve’ as one of its objectives. He has also been emphasizing, that the RBI will ‘facilitate the smooth completion of government’s borrowing program’. In the most likely scenario, the RBI will continue its bond purchases in the H2FY22 though at a somewhat slower pace. This will keep the liquidity tap open.
Foreign exchange flow is the most unpredictable piece in this equation. This could move in either direction depending on how the global monetary policy particularly that of the US and the domestic growth story evolve.
In 2013, the mere use of the term ‘Taper’ by then-Federal Reserve Chairman Ben Bernanke, caused tantrums across the world. That incident left the policymakers and particularly central bankers with a great deal of learning. Bernanke himself, later put it – “monetary policy is 98 percent talk and only two percent action”.
Over the last eight years, central banks have perfected the art of communication especially from the markets’ point of view. This can be seen in the recent speech of Fed chair Jerome Powell in the Jackson Hole symposium wherein he warned that tapering of asset purchases by end of 2021 is almost certain. But balanced his forward guidance in a way that markets perceived it as a dovish signal. Markets remained broadly unaffected.
The European Central Bank (ECB) followed the same tactics while they lowered the size of monthly purchases from EUR 80 billion to EUR 70 billion under its Pandemic Emergency Purchases Program (PEPP) last week. The ECB president Christine Lagarde termed the move a “recalibration” and differentiated it from tapering as she said - “the lady isn’t tapering”.
The big picture is that the central banks have become really sensitive to market sentiments. Thus, any reversal in the monetary policy will likely be at a very gradual pace. The actual tapering announcement by the US Fed could cause some volatility in some parts of the world but it’s unlikely to trigger a large systematic capital outflow from the broader emerging market pack.
India has been a big recipient of foreign capital in the last 18 months. If not for an external shock the trend may continue. Thus, in the absence of any external intervention from the RBI, liquidity surplus is unlikely to fall below Rs. 10 trillion in this financial year.
Outlook - Changing Macro Landscape
Short-term yields will continue to track the overall liquidity situation and potential policy normalization. The RBI is expected to start hiking the reverse repo rate as soon as December this year. If that is to happen, short-term bond yields will likely move higher by the year-end. For now, persistent high liquidity surplus should continue to keep short-term rates low.
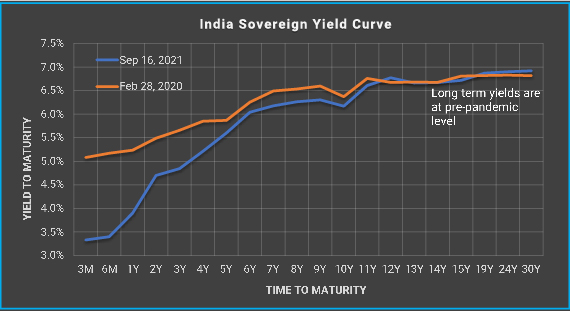
In the August 2021 edition of the Debt Market Observer - Investing In The New Normal we argued that the RBI will be slow to act and the terminal policy rates will be well below their pre-pandemic normal. This makes the long-end bonds really attractive. Though yields have come down by about 20-25 basis points at the long end, it still offers a reasonable valuation.
Softening inflation momentum and better than expected tax collections will also lend support to long-term bonds.
Chart – IV: India Sovereign Yield Curve is steepest in a decade
Source: Refinitiv, Quantum Research | Data as of September 16, 2021
Balanced and Dynamic Allocation
Given the above-market view and need for balanced risk exposure, Quantum Dynamic Bond Fund (QDBF) is currently positioned as a barbell. Under this strategy, a part of the portfolio is invested in above 10-year maturity bonds, while the other part is invested in short-term (below 3-year maturity) bonds.
In our opinion, the longer-term bonds are attractively priced and have the potential to gain over the medium to long term. Exposure to short-term bonds is a balancing position to lower the overall portfolio duration or sensitivity to interest rate changes.
We understand that the economy and markets are currently adjusting to an unprecedented shock. There are too many moving parts and things are still evolving. Thus, any forecast about the future is susceptible to change based on policy responses from the government and the RBI and the changes in global markets.
We stand vigilant to review our outlook as and when new information comes. We retain our right to remain dynamic in our portfolio construction to respond to the evolving economic and market conditions.
Liquidity Risk Management Framework In Terms of SEBI Guidelines
Quantum Liquid Fund (QLF) and Quantum Dynamic Bond Fund (QDBF) have adopted an updated liquidity risk management framework in accordance with the SEBI circular SEBI/H0/IMD/IMD-11 DOF3/P/CIR/ 20211583 dated June 25, 2021 and AMFI Best Practices Guidelines Circular 93 dated July 24, 2021.
Under this framework, schemes will keep certain part of portfolio in liquid assets as defined by the AMFI to cover potential outflows from the scheme. The liquidity ratio will be calculated and maintained as per the methodology provided by the AMFI (Click for the detailed guidelines).
Since the QLF and the QDBF invest major part of their investment in government securities which is part of the eligible liquid assets for maintenance of liquidity ratio, there will not be any change in the portfolio process of the schemes due to this framework.
For any queries directly linked to the insights and data shared in the newsletter, please reach out to the author – Pankaj Pathak, Fund Manager – Fixed Income at [email protected].
For all other queries, please contact Neeraj Kotian – Area Manager, Quantum AMC at [email protected] / [email protected] or call him on Tel: 9833289034
*Information referred above are illustrative and not recommendation of Quantum Mutual Fund/AMC. The Fund may or may not have any present or future positions in bond / stock of the above company. The above information of yield curve which is already available in publically access media for information and illustrative purpose only and not an endorsement / views / opinion of Quantum Mutual Fund /AMC. The above information should not be constructed as research report or recommendation to buy or sell of stock/ bond. Past Performance may or may not be sustained in future.
| Name of the Scheme | This product is suitable for investors who are seeking* | Riskometer |
| Quantum Liquid Fund An Open Ended Liquid Scheme | • Income over the short term • Investments in debt / money market instruments | 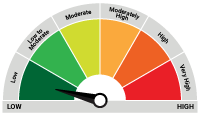 Investors understand that their principal will be at Low Risk |
| Quantum Dynamic Bond Fund An Open Ended Dynamic Debt Scheme Investing Across Duration | • Regular income over short to medium term and capital appreciation • Investment in Debt / Money Market Instruments / Government Securities | 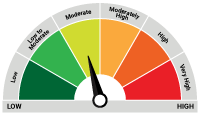 Investors understand that their principal will be at Moderate Risk |
The Risk Level of the Scheme in the Risk O Meter is based on the portfolio of the scheme as on August 31, 2021.
Disclaimer, Statutory Details & Risk Factors:
The views expressed here in this article / video are for general information and reading purpose only and do not constitute any guidelines and recommendations on any course of action to be followed by the reader. Quantum AMC / Quantum Mutual Fund is not guaranteeing / offering / communicating any indicative yield on investments made in the scheme(s). The views are not meant to serve as a professional guide / investment advice / intended to be an offer or solicitation for the purchase or sale of any financial product or instrument or mutual fund units for the reader. The article has been prepared on the basis of publicly available information, internally developed data and other sources believed to be reliable. Whilst no action has been solicited based upon the information provided herein, due care has been taken to ensure that the facts are accurate and views given are fair and reasonable as on date. Readers of this article should rely on information/data arising out of their own investigations and advised to seek independent professional advice and arrive at an informed decision before making any investments.
Mutual fund investments are subject to market risks read all scheme related documents carefully.
Please visit – www.quantumamc.com/disclaimer to read scheme specific risk factors. Investors in the Scheme(s) are not being offered a guaranteed or assured rate of return and there can be no assurance that the schemes objective will be achieved and the NAV of the scheme(s) may go up and down depending upon the factors and forces affecting securities market. Investment in mutual fund units involves investment risk such as trading volumes, settlement risk, liquidity risk, default risk including possible loss of capital. Past performance of the sponsor / AMC / Mutual Fund does not indicate the future performance of the Scheme(s). Statutory Details: Quantum Mutual Fund (the Fund) has been constituted as a Trust under the Indian Trusts Act, 1882. Sponsor: Quantum Advisors Private Limited. (liability of Sponsor limited to Rs. 1,00,000/-) Trustee: Quantum Trustee Company Private Limited. Investment Manager: Quantum Asset Management Company Private Limited. The Sponsor, Trustee and Investment Manager are incorporated under the Companies Act, 1956.
Related Posts
-

The Pivot
Posted On Friday, Apr 21, 2023
The fiscal year 2022-23 has come to an end. The defining feature
Read More -

Yield Curve Inversion Ahead
Posted On Thursday, Mar 23, 2023
Indian money markets have tightened meaningfully over the last one and a half month.
Read More -

Past, Present, and Future of Inflation
Posted On Friday, Feb 24, 2023
Inflation has been one of the biggest challenges in the post-pandemic world.
Read More


