The Golden Dove (Dow)
Posted On Wednesday, Mar 04, 2009
Gold prices recently have not perched itself on the leading lady`s head like the dove "Masakali", in the latest hindi movie "Delhi 6". The gold prices are flying higher and higher. Gold revisited the $1,000/oz mark in February on increased demand from investors as a "store of value" and "a safe haven" in midst of the deteriorating global scenario. Although profit booking and volatility has pulled it down in the short run to $915 levels, the long term uptrend remains intact. Gold in INR remains the best performing asset class in 2009 (13.8%: upto 27th Feb 2009).
Globally it’s been a cocktail of falling stock and housing markets and a deteriorating investor confidence, all in all, instable and fragile financial markets. This certainly justifies the investors’ penchant for Gold.
With this rise in Gold prices and falling stock markets, contrarian investors are ready with their guns to take on "opposite bets". Such investors go long on the so called cheaper stocks markets and short Gold. Will these investors be on the right side? Wish we had a crystal ball to peek in future. But, history does provide us with some reflections as to what the relative valuations of Gold and stock markets have in store for us.
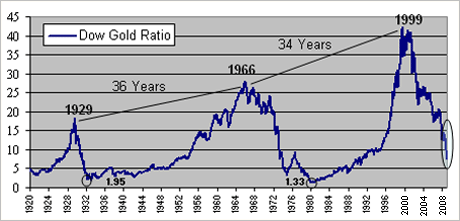
We tried to evaluate the relative valuations or relationship between the stock markets globally and the Gold prices. For stocks we chose the US stock markets (Dow Jones Industrial average (Dow)) as a barometer for global stocks. To establish an historical relationship we calculated a ratio known as "Dow Gold Ratio".
The ratio reflects how much investors are willing to pay for the Dow index in terms of gold. As we all know Dow is a measure of market values of listed companies and Gold is decade’s long measure of real asset value. A higher Dow reflects the overall well being of the US economy, earnings and vice versa. Whereas, a higher Gold price reflects the economic uncertainty and vice versa. Usually Dow and Gold are negatively correlated viz move in opposite direction over a longer time horizon.

Source: Bloomberg
As seen in chart above, the Dow Gold ratio peaked at 42.36 in 1999 and has since been falling. It currently stands at 7.3. The Dow/gold ratio has fallen about 83% from its 1999 peak, which occurred when equities reached their highs at the top of the dot-com bubble and gold traded at 20-year lows.
Historically the Dow Gold ratio has peaked after intervals of nearly 35 years on an average. After each of the peaks, the ratio has fallen rapidly on a multi year downtrend to bottom out below 2 (two). The fall in ratio was on account of stock markets collapsing accompanied by a rally in gold.
Currently, the ratio stands at 7.3. If history repeat’s itself like in previous two cycles and the Dow Gold ratio sinks below 2, where would be the Gold price? Read on.........
Table I provides a good insight on the various scenarios that can evolve if the Dow Gold ratio retraces back fully to its cyclical lows below 2.
| Scenario`s | Ratio | Dow Jones Industrial Average (Dow) | Gold (US$ / Troy Oz.) |
| Current Levels# | 7.3 | 6726 | 916 |
| Scenario`s | Ratio | Projected Dow | Projected Gold |
| If Dow remains unchanged | 2 | 6,726 | 3363 |
| If Dow further falls by 50% from current levels | 2 | 3363 | 1682 |
| If Dow increases by 10% | 2 | 7399 | 3699 |
| If Gold Remains unchanged | 2 | 1832 | 916 |
* The Table above is purely illustrative and indicates potential gold prices assuming Dow / Gold ratio at 2.0. Actual Dow / Gold ratio may be higher or lower than 2.0.Past performance may or may not be sustained in future. # Data as on 3rd March 2009, Source: Bloomberg, www.Quantumamc.com
If history gives us an opportunity to peek into the future, Gold has tremendous potential to do well.
Related Posts
-

Understanding GIPS: The Global Standard for Performance Reporting
Posted On Wednesday, Jan 14, 2026
In the world of investing, everyone loves a good performance number.
Read More -

Equity Monthly for January 2026
Posted On Friday, Jan 02, 2026
Indian markets remained range-bound in 2025
Read More -

Gold Monthly for January 2026
Posted On Thursday, Jan 01, 2026
Gold Market Review and Outlook: 2025–2026
Read More


