Tariffs Pressures , GST Reforms , Rising Yields: India’s August Bond Story
Posted On Monday, Sep 29, 2025

August in the Indian bond market was nothing short of chaotic, with constant surprises and swings. The month kicked off with U.S. President Trump's tariff hike on India, which added pressure. The RBI's rate pause further fueled uncertainty, with markets fearing it to be the end of the rate cutting cycle.
Mid-month, S&P's credit rating upgrade briefly lifted sentiment, but optimism quickly faded after PM Modi’s GST 2.0 proposal raised concerns over revenue losses. As hopes for softer U.S. tariffs faded upon negotiations, the worst-case scenario hit when the higher tariffs went into effect. This added to market turbulence.
Despite a surprise 7.8% GDP growth in Q1FY26, inflation-adjusted growth was weaker than it appeared, and fiscal deficits soared due to weak tax collections and rising spending.
In the next section, we’ll dive deeper into these factors and our outlook for the rest of the year.
1) India’s Tariff Troubles - Tariff Shock Could Trim India’s Growth by ~40–70 bps
In August 2025, the U.S. announced two rounds of 25% tariffs on Indian goods (total of 50%). This matters because the U.S. is one of India’s biggest buyers, taking about one-fifth of our exports .
While crucial sectors like pharma, fuels, and critical minerals were kept out of the tariff net, many labour-intensive industries such as textiles, carpets, gems & jewellery, and processed food are directly hit.
At the same time, India has rolled out GST 2.0 reforms, which lowered indirect taxes. This has put more money in consumers’ hands and potentially reduced costs for businesses. Thus, in the short run, GST cushions the blow from weaker exports by boosting local demand.
Our estimate show that these tariffs could shave off ~0.3% to ~0.8% from India’s GDP in 2025. If tariffs last longer, the drag could compound over the next two years.
And here’s the bigger worry: countries like Vietnam, which face lower tariffs, could become more attractive to U.S. buyers and global investors. That means India not only risks losing sales today but also manufacturing investments that could have come here tomorrow.
| Scenario | 2025 Impact | 2026–27 Outlook | What It Means |
|---|---|---|---|
| Best Case (tariffs rolled back) | GDP slows only slightly (~20- 30 bps, neutralized by GST 2.0 roll out). | No further drag. | Exports bounce back by the end of the year; GST reforms support steady growth. |
| Base Case (tariffs remain) | Moderate slowdown (~50 bps, partially offset by GST 2.0 roll out). | Smaller drags (~20 bps/yr). | Growth slows but stays resilient; some jobs & investments shift abroad. |
| Stress Case (tariffs persist + expand) | Steeper slowdown (~80 bps, GST 2.0 supportive in near term only). | Larger drag (~40 - 50 bps/yr). | Directed hit to consumption and export competitiveness; long-term challenges if supply chains shift out. |
While U.S. tariffs pose a short-term challenge, India’s economy is well-diversified and cushioned by GST reforms and strong domestic demand. Export-dependent sectors may face headwinds, but long-term opportunities remain robust in areas tied to domestic growth, such as infrastructure, financials, and consumer-driven industries.
The key takeaway: stay focused on the broader growth story, remain selective, and use periods of uncertainty as a chance to position for resilient, long-term returns.
2) GST 2.0: Big Reform, Bigger Implications
India is moving from a four-tier GST system (5%, 12%, 18%, 28%) to a simpler two-tier structure (5% and 18%), with a special 40% rate for sin goods like tobacco and luxury items. The goal is straightforward: make taxes simpler, improve compliance, and give a nudge to domestic consumption.
What’s Changing: Essentials move to 5%, non-essentials to 18%, and big-ticket items like two-wheelers and small cars benefit. Overall, this could lower effective tax rates, reduce prices across ~7–8% of the CPI (Consumer Price Index) basket, and shave ~30–40 basis points off inflation.
Fiscal Impact: The government expects a net revenue shortfall of about Rs 480 billion in FY26. Short-term losses may be offset over time by a wider tax base, increased economic activity, and other fiscal levers like record RBI dividends, divestments, and possible excise duty adjustments.
Bond Market Implications: While on the face of it, the fiscal deficit target of 4.4% of GDP faces a small upward risk, stabilizing factors like a record high RBI dividend, possible hike in excise duty for OMCs, targeting the pipeline of divestment projects (IDBI, some PSU banks) and an assumed Rs 500 bn of savings on revenue expenditure and RBI’s monetary policy should keep 10-year yields around 6.5–6.7%. If consumption-led growth accelerates and fiscal metrics stay on track, yields could stabilize further.
The Key Takeaway: GST 2.0 is a subtle win for consumers, supports domestic consumption, and provides a positive backdrop for bond markets from an economic lens. As always, the real impact will hinge on how much of the tax cut actually reaches consumers (pass- through) and fuels spending.
3) S&P Upgrades India’s Sovereign Rating
In August 2025, S&P Global Ratings upgraded India’s long-term sovereign rating from BBB– to BBB , with a stable outlook — the first upgrade in over a decade.
S&P Highlights:
- General government debt expected to decline from 83% of GDP (FY25) to 78% by FY29.
- FY26 GDP growth is projected at 6.5%.
- U.S. tariffs have only a marginal impact, affecting 1.2% of GDP in exposed exports.
- Headline Inflation projected at 4–4.5% (FY25–FY28).
- CAD (Current Account Deficit) expected at 1–1.4% of GDP through 2028.
Impact on Bonds: The upgrade gave a quick boost to government securities: the 10-year G-Sec yield dropped to 6.38%, the biggest one-day fall in two months. Investor sentiment improved, and expectations of foreign inflows rose. That said, the immediate impact may be modest, with future upgrades hinging on continued fiscal and economic stability.
The Key Takeaway: A better credit rating signals stronger macro fundamentals, boosts investor confidence, and is generally bond-friendly. Long-term investors can breathe a sigh of relief — India is officially on the radar for stable, high-quality debt.
4) India's Q1FY26 GDP growth - A positive surprise
India started off FY26 on a high note, with GDP (Gross Domestic Product) growing 7.8% year-on-year in Q1 — the fastest pace in five quarters. But before you start imagining an economy on, here’s the nuance: nominal GDP growth slowed to 8.8% from 10.8%. Why the gap? The GDP deflator (a measure of price changes in the economy) came in at just 0.9%, the lowest since Covid. Translation: the economy didn’t exactly run hotter — prices just stayed cooler than expected.
Chart I: Front-loading of capex led GFCF to expand by 7.8% YoY. Private consumption remained steady on the back of rural demand and tepid urban consumption
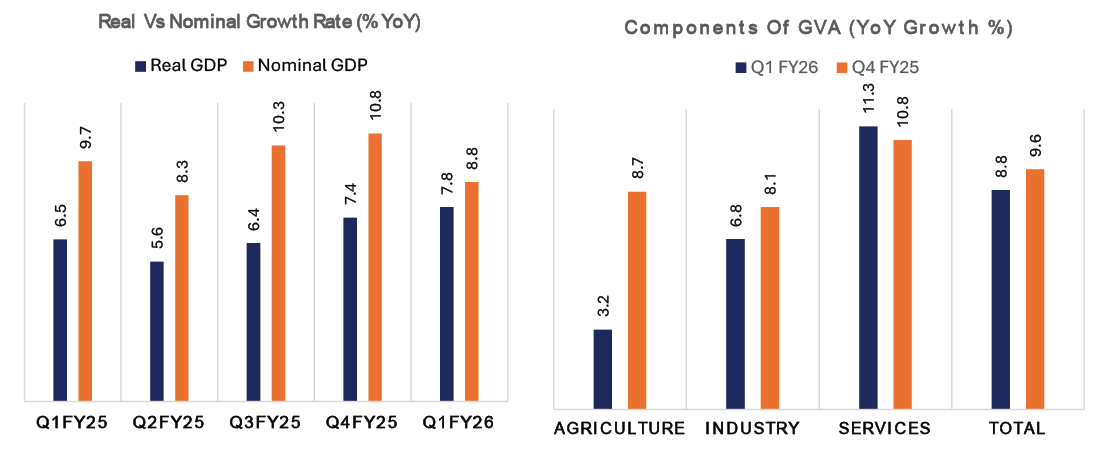
Source: CMIE. Quantum AMC Graphics. Data for the quarter ended in June 2025.
Demand Side Highlights
- Household spending rose 7%, supporting consumption.
- Government expenditure jumped 7.4%, driven by front-loaded election-linked outlays.
- Investments remained steady at 7.8%, keeping the investment rate near 30% of GDP.
- Imports surged 10.9%, while exports grew 6.3%, widening net imports and putting some pressure on domestic savings.
Supply Side Highlights
- Agriculture slowed to 2.8% , affected by weaker mining and farm activity.
- Industry held up at 7% , thanks to strong manufacturing and construction.
- Services led growth at 9.3% , powered by financial, real estate, and professional services.
- Net taxes rose sharply, reflecting fiscal support despite GST changes.
For FY26, we expect growth of 6.5%, with risks tilted to the downside due to new U.S. tariffs hitting exports and private investment. The silver lining? Domestic consumption should hold up, helped by soft inflation, recent tax relief, and the lagged effect of rate cuts.
The Key Takeaway: Think resilience over panic — sectors tied to domestic demand (like consumption, financials, and infrastructure) are likely to stay strong, while export-heavy industries may face headwinds.
5) Headline CPI Eases, But Core Keeps the Pressure On
India’s Consumer Price Index (CPI) slipped to 1.6% in July, near multi-year lows, and stayed soft at 2.1% in August, much in line with our estimates.
Food and Non-Food Trends: Food inflation remains contained, thanks to healthy crop output, adequate stocks, and normal monsoons, though temporary spikes in vegetables and pulses are possible after excess rainfall. Non-food inflation is also benign, with crude and global commodity prices trending lower. Core inflation stayed steady at 4.2%, while “core-core” inflation (excluding gold and fuel) remained subdued at 3.1%, highlighting limited demand-side pressures.
Chart II: CPI at Eight-Year Low: Food-Led Cooling Masks Sticky Core Pressures
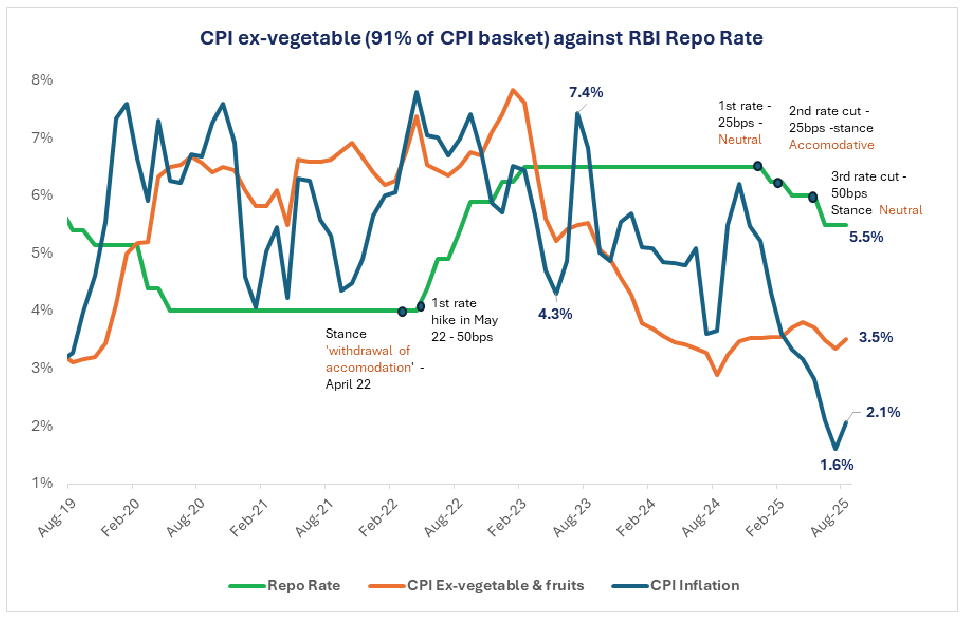
Source: MOSPI, RBI. Quantum AMC Graphics. CPI data is for the month of August 2025, Repo Rates are as of August 31, 2025, is unchanged at 5.5%.
Looking Ahead: The GST rate cuts kicking in late September should push headline inflation even lower in October. For FY26, CPI is expected to average ~2.7% (with a downward bias depending upon the pass through of the GST 2.0) against the RBI’s revised estimate of 3.1% for FY 26.
The Key Takeaway: Soft inflation is bond-friendly, easing pressure on yields while creating room for GST-driven demand, especially in consumer durables and makes room for the RBI to continue easing of the monetary policy. The key risk to watch is US tariffs in H2FY26, which could dampen some of the domestic positives.
6) RBI’s Monetary Policy – One More Cut, Then Wait-and-Watch
The Reserve Bank of India (RBI) has already cut rates by 100 basis points (bps) between February and June 2025. In August, the Monetary Policy Committee (MPC) hit pause, keeping rates unchanged and signaling that future moves will depend on incoming data.
Chart III: Expect one more 25 bps rate cut this year, followed by a prolonged pause
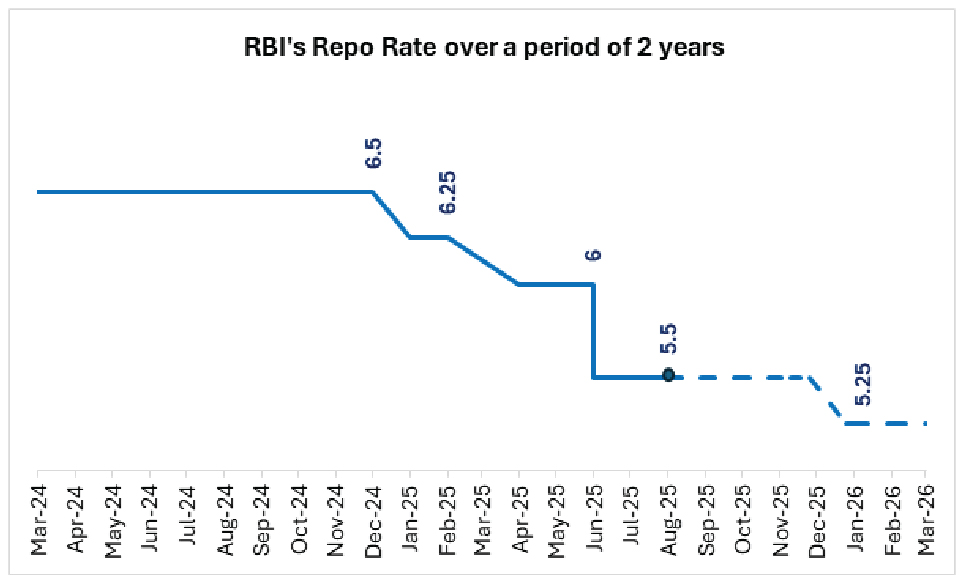
Source: RBI. Quantum AMC Graphics. RBI repo rates – Actual rate up to August 2025 and Projected starting September 2025 to March 2026.
This chart shows the movement in bond yields across different maturities, reflecting changes in the interest rate environment over time. It helps illustrate how market expectations around inflation, liquidity, and monetary policy influence yield levels. Tracking these trends allows investors to better understand interest-rate cycles and fixed-income market sentiment.
Our base case: One more 25 bps cut this fiscal, followed by a longer pause as the RBI gauges how quickly the easing is filtering through and as the base effect fades and inflation begins to edge up higher in H2FY26 and in FY 27.
The Key Takeaways: Policy remains supportive, but the scope for aggressive rate cuts is limited. Bond yields may drift lower, but don’t expect a deep easing cycle.
7) Fiscal Health – Stretch, But Manageable
The government is targeting a fiscal deficit of 4.4% of GDP for FY26, down from 4.8% last year, with total borrowings set at Rs 14.8 trillion (more than half front-loaded in the H1FY26). By July, the deficit had already reached around 30% of the annual target, slightly higher than last year, due to weaker tax collections and higher spending, though non-tax revenues have helped contain the slippage.
A key reform supporting fiscal consolidation is GST rationalization, which merges multiple slabs into 5% and 18%, with a special 40% rate for select items. While this is expected to reduce revenues by roughly Rs 48,000 crore, the simplification should improve compliance and efficiency over time.
Chart IV: GST 2.0 fiscal impact manageable; focus shifts to reducing debt-to-GDP.
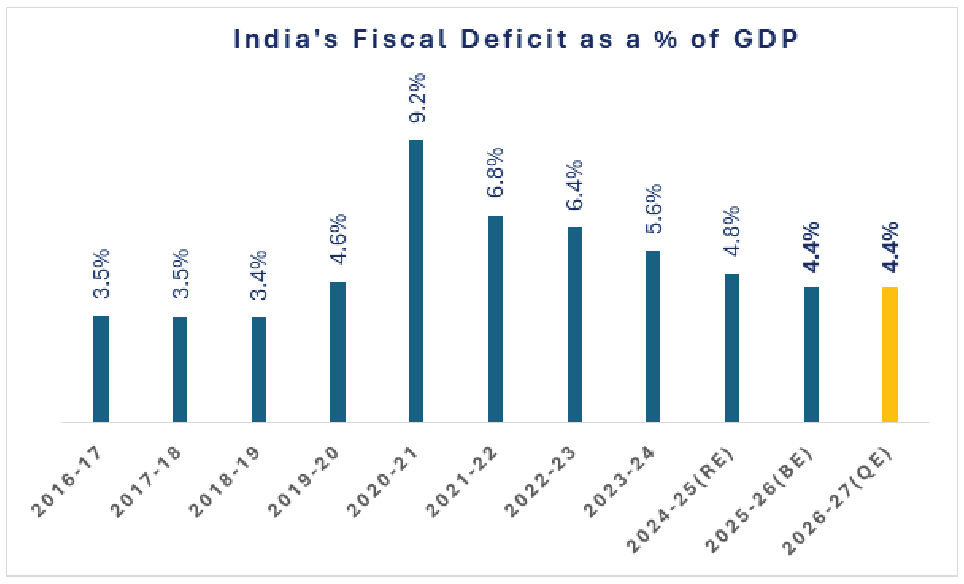
Source: RBI, India Union Budget Documents. Quantum AMC Graphics. RE: India’s Revised Budget Estimates. BE: India’s Budget Estimates and QE: Quantum’s Internal Estimate.
For FY26, the fiscal deficit target is likely to face a modest upward pressure of about 0.1% of GDP, which could be partially offset by a record-high RBI dividend, possible excise duty hikes for Oil Marketing Companies (OMCs), proceeds from divestments (including IDBI and select public sector banks), and an estimated Rs 5,000 crore savings on revenue expenditure.
Looking ahead, starting FY2026–27, the Union Government plans to adopt the debt-to-GDP ratio as its primary fiscal anchor, aiming to bring it down to 49–51% by 2031. We believe achieving this is realistic but won’t be a smooth ride more like a steady climb up a hill. Strong growth, fiscal discipline, and reform execution will drive progress, while global shocks and domestic pressures will create occasional bumps.
The Key Takeaways: For investors, this is a long-term positive for bonds and sovereign credibility, but short-term volatility and fiscal slippages should be factored into expectations. Heavy borrowing in H1 may keep short-term rates a bit elevated, but fiscal discipline provides long-term confidence.
8) Crude Oil Prices – A Rare Tailwind
Oil prices have been a pleasant surprise for India this year. Brent crude averaged $68.2 per barrel in August, roughly 16% lower than a year ago, and we expect FY26 prices to hover between $62–67 per barrel, compared with $79 last fiscal.
Why this matters: lower crude isn’t just about cheaper fuel at the pump. It helps keep inflation in check, reducing the cost of goods and services across the economy. It also shrinks the import bill, easing pressure on the current account, and lightens the fiscal burden, giving the government more room to spend or invest elsewhere. For the macro economy, this acts like a subtle tailwind — helping stabilize growth, supporting bonds, and providing policymakers with more flexibility in managing rates and fiscal priorities.
Chart V: Falling Brent Prices Offer India a Growth Cushion.
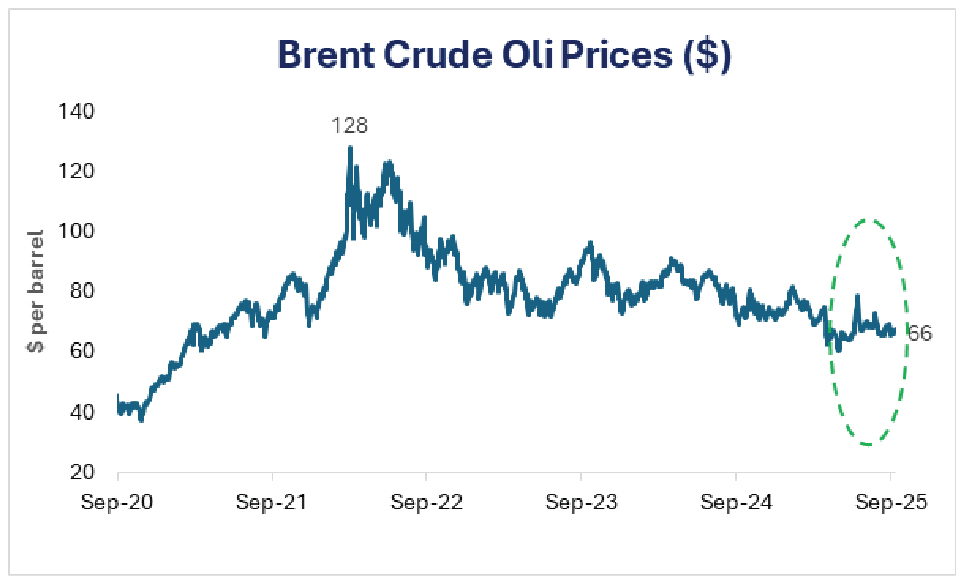
Source: Bloomberg. Quantum AMC Graphics. Data for the last five years starting September 2020 to September 15, 2025
This chart shows the trend in Brent crude oil prices and highlights how declining prices can benefit the Indian economy. Lower oil prices help reduce import costs for India, which is a major crude oil importer. This can ease inflationary pressures, improve the current account balance, and support economic growth. Overall, falling Brent prices act as a macroeconomic cushion for India by lowering energy-related costs across the economy.
The Key Takeaways: Falling oil prices are generally bond-friendly, easing inflationary and fiscal stress.
9) Current Account Balance – Still Comfortable
India’s CAD slipped to USD 2.4 bn (0.2% of GDP) in Q1FY26, reversing the Q4 surplus, as a wider trade deficit outweighed invisibles. Imports rose to USD 182 bn on stronger oil and non-oil demand, while exports softened to USD 113 bn. Invisibles held firm YoY — services rose 11% and remittances 20% — though they eased sequentially, cushioning the deficit.
Capital Account and BoP: On the capital account, India reported a surplus of USD 7.7 bn , up from a USD 5.4 bn deficit in Q4FY25. This was driven by higher foreign direct investment (FDI) of USD 5.7 bn, modest banking capital outflows of USD 1 bn, reduced external commercial borrowings (USD 4.5 bn), and positive foreign portfolio inflows (+USD 1 bn). Overall, the balance of payments recorded a surplus of USD 4.5 bn , supported mainly by capital inflows.
We expect the CAD to average around 0.8% to 0.9% of GDP for FY26, assuming Brent crude prices near USD 65- USD 67 per barrel. Upside risks remain, especially from U.S. tariffs on Indian exports, which could push the CAD to 1.0–1.2% of GDP. Even in a stressed scenario, the deficit should remain manageable (below 1.4%), supported by lower import demand, favorable oil prices, and moderate growth in services exports. The USD/INR is expected to average ~ 87.50 amid ongoing trade tensions and geopolitical uncertainties.
Yields view: India’s external position remains resilient. A manageable CAD, backed by strong services inflows and remittances, provides a buffer for the rupee and helps keep bond yields in check - a supportive backdrop for fixed income investors.
10) U.S. Federal Reserve – A Global Watchpoint
The U.S. Federal Reserve (Fed) faces a tricky balancing act: inflation remains elevated, but jobs data is softening.
As expected, the FOMC cut rates by 25bps, bringing the target range down to 4.0–4.25% . No surprises on the action itself. The real intrigue was in the messaging - dovish statement, but a hawkish press conference. The Fed’s official statement and dot plot leaned dovish, with a split Committee - seven members seeing no more cuts this year while nine expect two more - highlighting the lack of consensus on easing.
But Powell’s press conference struck a hawkish tone, downplaying the dots and framing the cut as mere “risk management,” leaving markets uncertain whether this is the start of a broader easing cycle. His core message: the Fed remains data-dependent, with no straightforward path ahead.
While Powell was clear this is not the start of a long easing cycle, we cannot rule out back-to-back cuts into year-end, especially if labor market weakness deepens. Last year’s cuts were also labeled “risk management,” and the Fed could again stop after just a handful of moves—unless employment risks materialize more sharply.
Why it matters for India: A softer Fed stance typically weakens the dollar, supports the rupee, and enhances the appeal of emerging market debt, including Indian bonds.
Global growth worries, trade tariffs and a softer dollar may give the RBI a little more wiggle room as now instead of fighting every move in the FX market, they can focus on policy at home.
In this context, RBI’s strict focus on its 1-year-ahead inflation forecast may be misplaced. Moreover, rupee weakness versus peers should be seen as a natural stabilizer for growth, not necessarily a constraint on policy easing.
The Key Takeaways: Easing U.S. rates can support foreign inflows into Indian bonds, keeping yields capped on the upside.
11) Supply vs. Demand – Borrowings and Appetite
In August, trading volumes in G-secs dropped 29% MoM , corporate bonds slipped 7.8% , while SDLs (State Development Loans) surged 37% and T-bills stayed broadly flat (+0.4%). Meanwhile, CDs (Certificate of Deposit) and CPs (Commercial Paper) posted strong gains of 13.5% and 18% , respectively. Overall, the data points to a clear rotation away from G-secs and corporate bonds toward SDLs during the month.
On the supply side, state borrowings through SDLs were front-loaded : by August, states had borrowed Rs 3.8 lakh crore, or 68% of their H1FY26 target (vs. 59% last year). Corporate bond issuance slowed in August due to elevated yields, but the pipeline looks strong.
On the demand side , insurance companies and pension funds maintain a moderately steady appetite for longer-tenure G-secs and SDLs. A consistent long-term demand helps absorb heavy supply and stabilizes the market.
Yields view: Higher issuance can push yields up, but strong institutional demand balances the scales.
12) Liquidity & Call Rates – Still Comfortable
Liquidity in the Indian banking system has been abundant since April, thanks to RBI injections and higher government spending. In August, surplus liquidity peaked at Rs 4.1 trillion on the 2nd of August 2025 and remained above Rs 3.0 trillion for most of the month. By late August, after RBI’s Variable Rate Reverse Repo (VRRR – a tool used by RBI to suck out liquidity) operations, surplus eased below ~Rs 2.0 trillion per day. This brought the overnight call money rate (the rate at which banks lend to each other) closer to the repo rate of 5.50%, ending the month at 5.44%.
Chart VI: Liquidity continues to be in a surplus, supported by RBI’s active management.
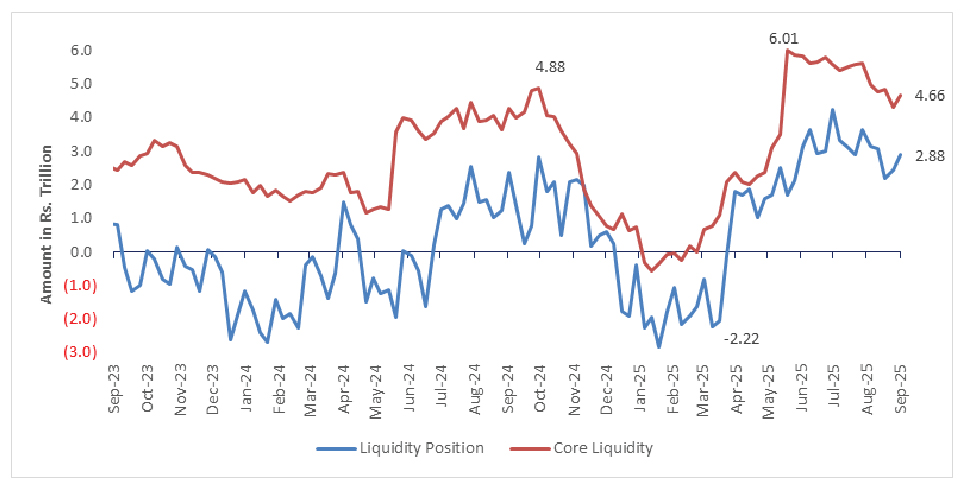
Source: RBI. Quantum AMC Graphics. Data up to the week ended September 5, 2025.
Liquidity for the first half of September 2025, continues to be in a surplus averaging at ~ Rs 2.4 trillion per day. However, owing GST outflows, the daily banking system liquidity surplus dropped to ~ 0.6 trillion and the RBI announced Variable Rate Repo Auction (VRR – a tool used by RBI to infuse liquidity) of Rs 25,000 crores. And we continue to see this being managed by the RBI in the week to follow until we start seeing the impact of month end spendings, taking the daily system liquidity slightly higher.
Yields view: Comfortable liquidity and anchored short-term rates keep the yield curve stable.
13) Indian Bond Yields Climb amid global market developments
Indian bond yields rose 20–30 bps across the curve in August 2025, reflecting the RBI’s cautious pause, S&P’s rating upgrade, tariff announcements, GST-related fiscal concerns, and weak demand in auctions.
The 10-year benchmark G-sec closed at 6.59% (+21 bps), while SDLs saw a sharper move, with the 10-year rising 36 bps to 7.23%, pushing spreads to ~64 bps (vs. 12M avg. ~41 bps). Corporate bond yields also edged higher, with 10-year AAA PSU yields up 15 bps to 7.19%, and the spread over G-secs at ~60 bps. The term premium between the 10-year G-sec and TREPS widened to ~110 bps, nearly double its 12-month average.
Chart VII: Upward Pressure on Indian Bond Yields Driven by Auctions, SDL Supply, and Fiscal Signals
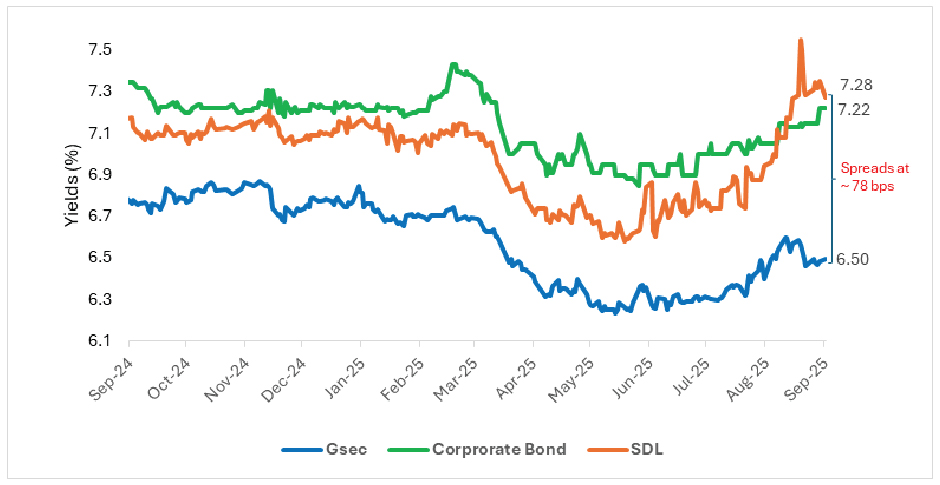
Source: Bloomberg, NSE Cogencis. Quantum AMC Graphics. Above data is as on September 15, 2025 for 10-year maturity benchmark papers for G-Sec, SDL and AAA Rated PSU Corporate Bond.
In contrast, money market yields remained steady, supported by RBI liquidity operations (VRR/VRRR). T-bill rates were stable, and 3-month AAA PSU CP/CD rates closed in the 5.8–6.1% range.
Globally, US Treasury yields softened to 4.23% in August from 4.36% in July, as rate-cut expectations gained traction, even as US PCE inflation ticked higher amid tariff pressures. The spread between Indian 10-year G-secs and US Treasuries widened to 237 bps (vs. 202 bps in July), though still below its 12-month average of 229 bps.
The Key Takeaway: The sharp rise in Indian bond yields highlights emerging supply pressures and fiscal concerns, even as global rates soften. For investors, this creates a tactical opportunity at the shorter end of the curve, while caution is warranted on the long end until demand stabilizes.
14) The Hidden Cost of Defending the Rupee
While the rupee’s depreciation offers India some cushion against the impact of U.S. tariffs, it may revive a dilemma for the RBI - whether to intervene in the forex market to stabilize the currency or prioritize domestic liquidity and growth.
While intervening in forex markets helps stabilize the INR, it also drains rupee liquidity, tightening financial conditions. This has, in the past, coincided with slower deposit growth and reduced credit momentum. The RBI may again rely on quiet liquidity management, but this may still risk slowing credit expansion, especially when growth remains uneven.
If the likely pressure on the balance of payments returns, a large-scale intervention could unintentionally act as a brake on lending. Thus, defending the rupee may bring short-term currency stability, but it could also tighten liquidity and hinder credit growth at a delicate time for the economy.
Chart VIII: INR Faces Continued Headwinds Amid Global Volatility
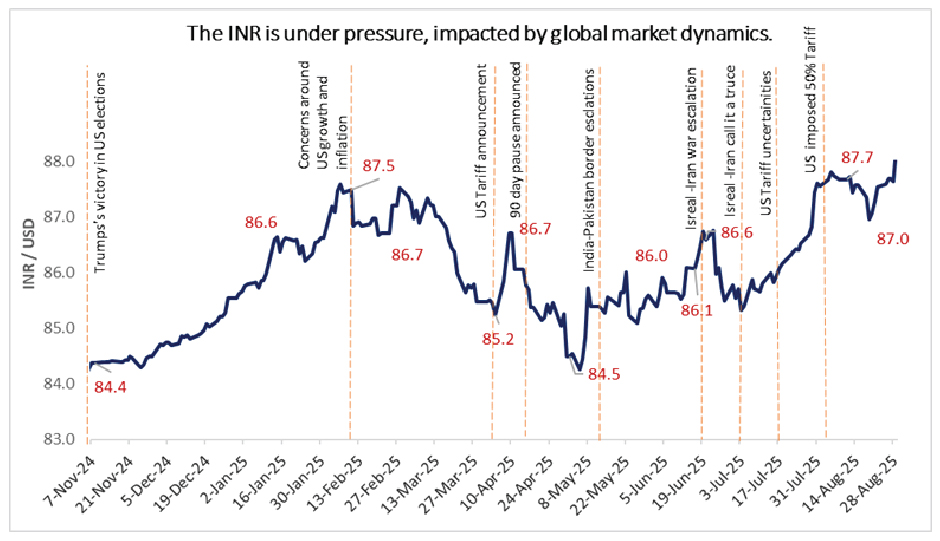
Source: Bloomberg. Quantum AMC Graphics. The above data is for the period starting from the victory of Donald Trump in the US Presidential elections (06th November 2024) till the month ended August 2025.
This chart highlights the movement of the Indian Rupee (INR) against the US Dollar during a period of global market volatility. It shows how external factors such as global risk sentiment, capital flows, and geopolitical developments can exert pressure on the currency. Periods of rupee weakness typically reflect stronger dollar trends, foreign capital outflows, or rising global uncertainty. Overall, the chart illustrates the headwinds faced by the INR in a volatile global financial environment.
15) Foreign investments in IGBs (Indian Government Bond)
with the debt segment attracting $725 million during the month. However, this momentum faces risks amid rising global trade tensions under the Trump administration, increasing crude oil prices, and concerns about a potential pause in the RBI's rate-cut cycle, which have heightened caution and led to net outflows.
Looking ahead, in the medium term, global financial markets are expected to see reduced volatility. The USD is likely to stabilize within its current range, which could trigger a reversal of the safe-haven trade, boosting capital flows into emerging markets like India.
Chart IX: Amid Global Jitters, Indian Bonds saw inflows; August Marks a Modest Rebound
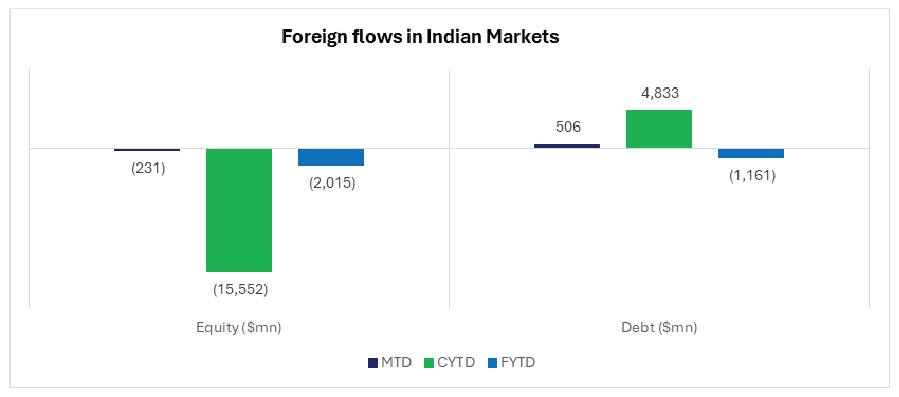
Source: CCIL, Bloomberg. Quantum AMC Graphics. Data up to September 15, 2025.
This chart highlights the trend in foreign portfolio investments (FPI) into Indian government bonds over recent months. Despite global market uncertainty and risk aversion, Indian bonds experienced renewed inflows in August, indicating continued investor interest in India’s fixed-income market. The rebound suggests that attractive yields and relatively stable macroeconomic fundamentals are drawing capital back into Indian debt. Overall, the chart reflects a modest recovery in bond inflows amid global financial volatility.
Our View:
Despite the flurry of economic and geopolitical developments, we remain constructive on the Indian bond market. Several macro fundamentals continue to align in favour of a supportive rates environment: inflation is softening meaningfully , the fiscal slippage risk appears manageable , and 25 bps rate cut is likely to be back on the table before the end of FY26.
Headline CPI has fallen to multi-year lows, and while base effects could nudge year-on-year inflation higher ahead, we believe the underlying momentum remains benign. Food stocks are healthy, core inflation is subdued, and global oil prices remain in check (all of which support the case for further easing by the RBI).
On the fiscal front, though pressures are emerging from proposed GST reforms, weak tax collections, and higher spending needs, the downside appears contained. Our estimates suggest a very low probability of a modest fiscal slippage which we believe could potentially be managed through short-term funding rather than aggressive bond issuance.
Externally, while trade tensions with the US pose risks, India’s balance of payments appear resilient . Even if the current account deficit (CAD) widens modestly, ample FX reserves provide a buffer, and import compression may help offset some of the export slowdown.
Meanwhile, foreign investors have shown growing interest in Indian debt , particularly as long-end yields rose, and the rate-cut narrative gained traction. With the global backdrop still uncertain, India's macro stability, deepening bond market, and real rate advantage makes Indian bonds relatively attractive.
That said, our near-term view is tempered by persistent uncertainties, most notably the upcoming GST Council deliberations in September . The tax reform has enormous potential to simplify structures and spur consumption, but its market impact will depend on how revenue sharing and producer pass-through play out. The fiscal math and inflation trajectory could look very different depending on the outcome .
The reform, coupled with monetary support and contained inflation, underpins our medium-term positive view on bonds , even if the near-term path remains volatile.
In line with this view, we have reduced the portfolio duration and are exploring spread assets – SDLs and high quality AAA Rated PSU bonds, to safeguard capital and better navigate a likely consolidation phase in bond markets.
What can investors do?
Given the current environment, bond yields are likely to either decline or remain range-bound . In such a volatile interest rate landscape, investors with a medium to long-term horizon may consider dynamic bond funds . These funds offer the flexibility to actively manage portfolio duration, allowing adjustments in response to evolving market conditions—making them well-suited for staying invested over longer periods. For those with shorter investment horizons or a lower risk appetite, liquid funds continue to be a more appropriate choice , offering stability and easy access to funds.
Source: Reserve Bank of India (RBI), Ministry of Statistics & Program Implementation (MOSPI), Bloomberg
For any queries directly linked to the insights and data shared in the newsletter, please reach out to the author - Sneha Pandey, Fund Manager - Fixed Income at [email protected].
For all other queries, please contact Mohit Bhatnagar - Head - Sales, Quantum AMC at [email protected] / [email protected] or call him on Tel: 9987524548
Read our last few Debt Market Observer write-ups -
- Why India Is the Market to Watch
- Indian Bonds in a Volatile Global Landscape
| Quantum Dynamic Bond Fund - Direct Plan - Growth Option | Current Value ₹10,000 Invested at the beginning of a given period | |||||
|---|---|---|---|---|---|---|
| Period | Scheme Returns (%) | Tier I - Benchmark# Returns (%) | Additional Benchmark## Returns (%) | Scheme Returns (₹) | Tier I - Benchmark# Returns (₹) | Additional Benchmark## Returns (₹) |
| Since Inception (19th May 2015) | 7.84% | 7.58% | 6.63% | 21,729 | 21,201 | 19,364 |
| 7 years | 7.59% | 7.78% | 7.15% | 16,689 | 16,891 | 16,220 |
| 5 years | 6.50% | 5.93% | 5.51% | 13,696 | 13,338 | 13,074 |
| 3 years | 7.98% | 7.31% | 7.82% | 12,590 | 12,359 | 12,534 |
| 1 year | 6.81% | 6.83% | 7.77% | 10,679 | 10,681 | 10,774 |
# CRISIL Dynamic Bond A-III Index ## CRISIL 10 Year Gilt Index. Past performance may or may not be sustained in the future.
Different Plans shall have a different expense structure. Returns are net of total expenses and are calculated on the basis of Compounded Annualized Growth Rate (CAGR). For performance of other schemes managed by the Fund Manager Click here
Product Labeling
Name of the Scheme | This product is suitable for investors who are seeking* | Risk-o-meter of Scheme | Risk-o-meter of Tier-I Benchmark |
|---|---|---|---|
Quantum Dynamic Bond Fund An Open-ended Dynamic Debt Scheme Investing Across Duration. A relatively high interest rate risk and relatively low credit risk. Tier I Benchmark : CRISIL Dynamic Bond A-III Index |
|  |  |
*Investors should consult their financial advisers if in doubt about whether the product is suitable for them.
Interest Rate Risk↓ / Credit Risk → | Relatively Low | Moderate (Class B) | Relatively High (Class C) |
|---|---|---|---|
| Relatively Low (Class I) | |||
| Moderate (Class II) | |||
| Relatively High (Class III) | A-III |
Disclaimer, Statutory Details & Risk Factors:
The views expressed here in this article / video are for general information and reading purpose only and do not constitute any guidelines and recommendations on any course of action to be followed by the reader. Quantum AMC / Quantum Mutual Fund is not guaranteeing / offering / communicating any indicative yield on investments made in the scheme(s). The views are not meant to serve as a professional guide / investment advice / intended to be an offer or solicitation for the purchase or sale of any financial product or instrument or mutual fund units for the reader. The article has been prepared on the basis of publicly available information, internally developed data and other sources believed to be reliable. Whilst no action has been solicited based upon the information provided herein, due care has been taken to ensure that the facts are accurate and views given are fair and reasonable as on date. Readers of this article should rely on information/data arising out of their own investigations and advised to seek independent professional advice and arrive at an informed decision before making any investments.
Mutual fund investments are subject to market risks read all scheme related documents carefully.
View All
Related Posts
-

What Does the West Asia Crisis Mean for India’s Economy?
Posted On Tuesday, Mar 24, 2026
Over the past few years, geopolitics has steadily returned to the center of global economic discussions.
Read More -

Looking Beyond the 10-Year Benchmark: Decoding India’s Bond Market Signals
Posted On Thursday, Feb 26, 2026
If you glance at India’s financial headlines today, the tone feels reassuring.
Read More -
Positioning for Disinflation
Posted On Friday, Jan 27, 2023
We are well past the peak inflation of 2022. Yet, inflation continues to be the focal point of all the policy discussions and investment thesis in 2023.
Read More

