Past, Present, and Future of Inflation
Posted On Friday, Feb 24, 2023
Inflation has been one of the biggest challenges in the post-pandemic world. Advanced economies, which were struggling to pull inflation up to 2% for most of the last decade, are now fighting close to double-digit inflation.
India, as well, witnessed relatively higher inflation in the last three years. The CPI inflation averaged 6.2% between 2020-2022 as against 4.2% between the 2015-2020 period.
The reserve bank of India, though expects the headline CPI inflation to decline from the current levels of more than 6%, is worried about its characteristics, particularly the stickiness of the core inflation.
The monetary policy committee, the rate-setting body of the RBI, seems divided in its assessment of current inflation drivers and its outlook.
The RBI Dy. Governor, Dr. Michael Patra characterised the current inflation as unconscionably elevated, persistent, and generalised and made a case to continue monetary policy tightening to quell it.
While on the other hand, external MPC members Dr. Ashima Goyal and Professor Jayant Verma pointed towards a slowing global economy, easing supply chain pressures and front-loaded monetary policy tightening as strong disinflationary forces and favoured a pause.
Whose version of inflation characterisation is true, only time will tell. However, we can always look back in history and apply the learnings to build possible scenarios.
The History
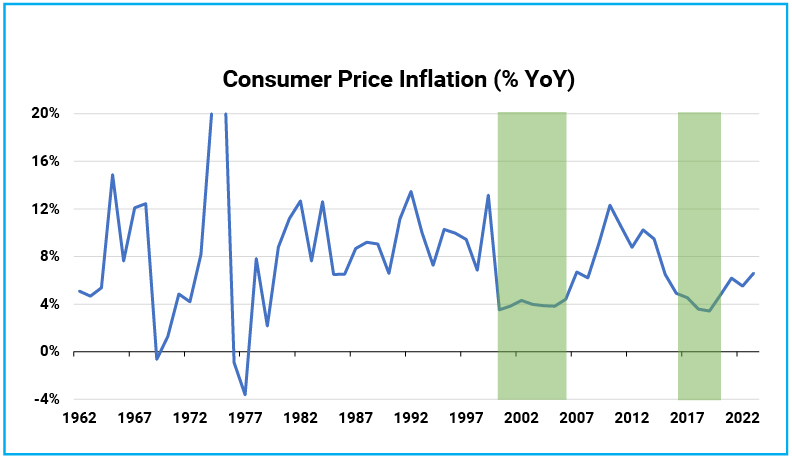
India has a checkered past with inflation. In the early phases of independent India between 1950-1980, inflation was mostly characterized by supply-side shocks related to wars, droughts, oil prices, and agriculture output. Inflation was generally high and volatile during this period. There were also short periods of deflation during the early 1950s and late 1960s caused by bumper agricultural output and the green revolution.
During the 1980s, the government’s expansionary fiscal policy and money printing gave a disproportionate boost to demand and led to persistent high inflation. Inflation, as calculated by CPI industrial workers (CPI-IW), averaged 9.2% in that decade.
The 1990s started with unsustainable macroeconomic imbalances that forced the government to undertake a large devaluation of the Rupee and implement radical structural reforms to open the economy. Consequent large foreign capital inflows resulted in a rapid monetary expansion in the economy. This kept inflation elevated for the most part of the decade. Inflation averaged around 9.5% during this period.
Chart – I: India’s Inflation History- High & Volatile
Source – CMIE, MOSPI, Quantum Research, Data as of February 20, 2023
^Current CPI index started in January 2011. CPI – Industrial Workers (CPI_IW) is used as a proxy for CPI Inflation for the pre-2011 period.
Fruits of structural reforms and capacity building were reaped during the early parts of the 21st century when GDP growth picked up meaningfully but inflation at the consumer level remained relatively muted. The CPI-IW averaged 4.6% between the 2000-2007 period.
2008, came the global financial crisis. It opened a new chapter in India’s inflation history which is more relevant in today’s context. For better understanding, the post-GFC period can be divided into three parts.
1) Inflation Spiral (2008-2014)
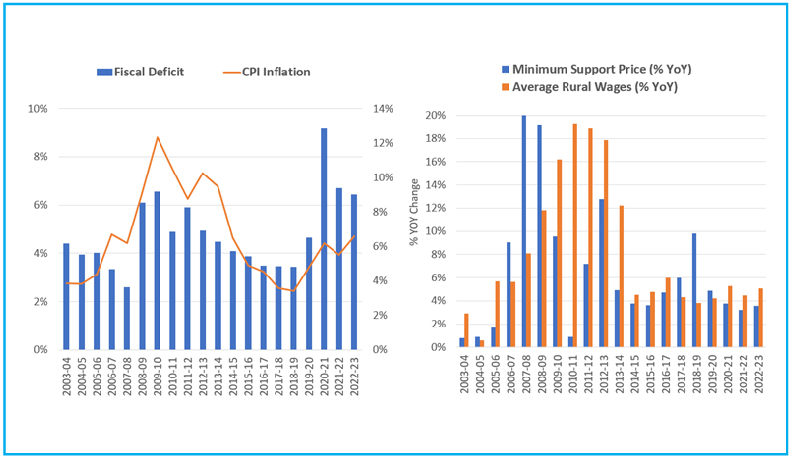
During the global financial crisis, economic growth and inflation collapsed across all major economies around the world. But surprisingly, in India, inflation moved higher despite a meaningful slowdown in growth.
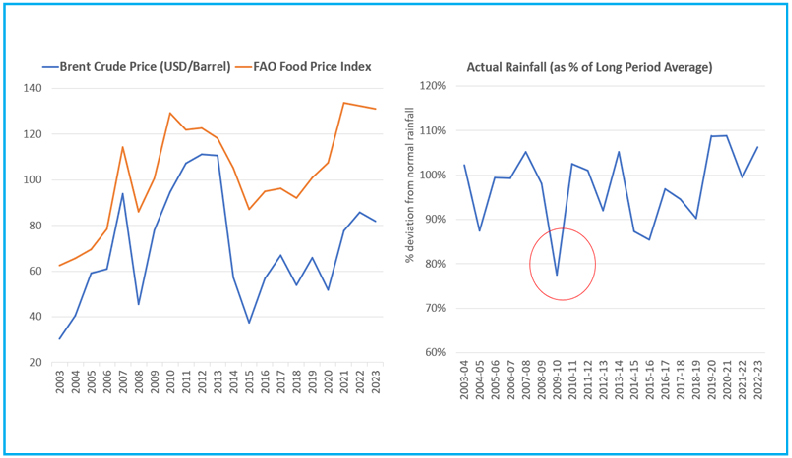
To pull the economy out of the crisis, the Government added a sizeable fiscal stimulus in 2008 and 2009. These also included a sharp jump in the minimum support prices for major food grains which in turn pushed the food inflation significantly higher. At the same time, rural wages also picked up abruptly due to the rural employment guarantee scheme (MG-NAREGA) and booming labour-intensive construction activities.
A severe drought in 2009 and a spike in crude oil prices during 2011-2012 worsened the inflation situation even further. Consumer inflation averaged over 10% between 2008-2014.
Chart - II: High Fiscal Deficit, sharp increase in MSP and Rural wages along with global price pressures and drought pushed inflation higher during 2008-2014
Source - MOSPI, Bloomberg, Quantum Research; Data up to 2022-23
Despite having so many things to blame, the role of policy miscalculation cannot be ignored in fuelling this inflation spiral. The government was slow in reversing the fiscal stimulus despite a sharp rebound in economic growth, and the RBI for the most part kept its focus on wholesale inflation (WPI) while prices at the consumer level continued spiralling higher.
This period became a case study for future reforms to control inflation.
2) Inflation Targeting and resultant moderation (2014-2020)
With persistent high inflation and wide fiscal and current account deficits, India became part of the fragile five economies during the Taper Tantrum episode in 2013. This was a landmark event in India’s inflation history. It led to major reforms in monetary policymaking.
The RBI adopted inflation as its primary target and switched its inflation measure from wholesale inflation (WPI) to Consumer Price Inflation (CPI). This drastically changed the conduct of monetary policy with a clear focus on controlling inflation.
The Government also corrected its fiscal policy. It reduced the fiscal deficit and announced a series of reforms addressing bottlenecks in the agriculture supply chains. All these measures helped in bringing down inflation to nearly 4%.
The drop in crude oil prices during 2014-15 and slow GDP growth post-demonetisation and GST implementation also put downward pressure on inflation. The CPI inflation averaged 4.6% between April 2014 to March 2020.
3) Pandemic led Inflation resurgence (2020 and beyond)
Inflation once again rebounded in the last three years. Pandemic led lockdowns disrupted the global supply chains and led to shortages of many essential goods. Commodity prices also shoot up due to years of under investments in the sector and the war between two large commodity producers Russia and Ukraine.
With the impact of these shocks receding, inflation has now started to come down. However, the bigger question is – How much and how quickly can inflation fall? Where will it stabilise?
Taking cues from the past, we can place the following points that differentiate the current inflation backdrop from all the past many inflationary periods-
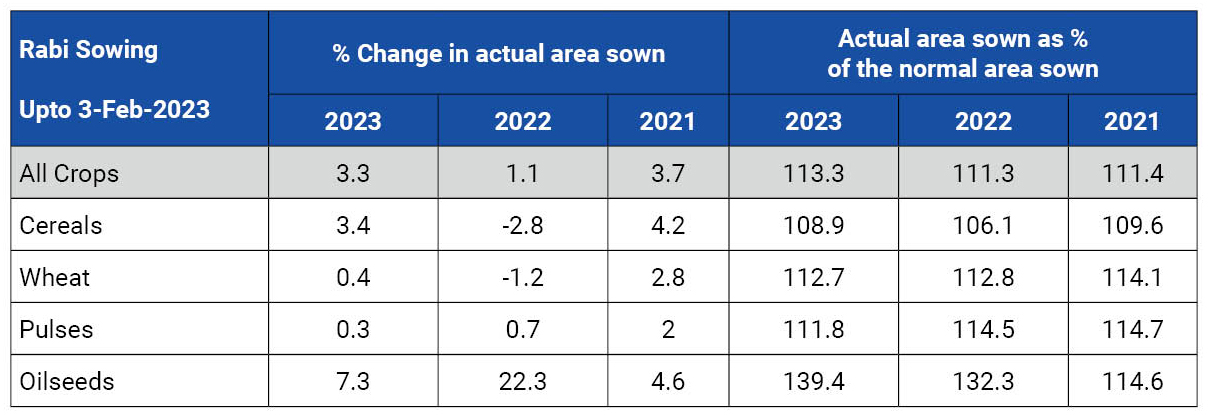
a. Unlike many of the past inflationary periods, this time there is no shock in agricultural output. On the contrary, agriculture output is estimated to post a new record in 2023.
The sowing of Rabi crops is progressing well with a 3.3% YoY increase in the area sown. Actual acreage as of February 3, 2023, was 113.3% of normal. This is also supported by higher-than-normal water reservoir levels.
Table – I: Rabi sowing progress & Water level
CMIE, Quantum Research, Data as of February 3, 2023
Table – II: Reservoir Water storage levels

CMIE, Quantum Research, Data as of February 3, 2023
Prices of cereals have moved up sharply in the last 12 months due to global shortages and price rises in global markets. As the new crop comes, prices should stabilise in the coming months.
b. Though the fiscal deficit is relatively high, the government's expenditure pattern has changed significantly in favour of capital spending. Over the medium term, capital spending should help in removing supply bottlenecks and bringing down inflation.
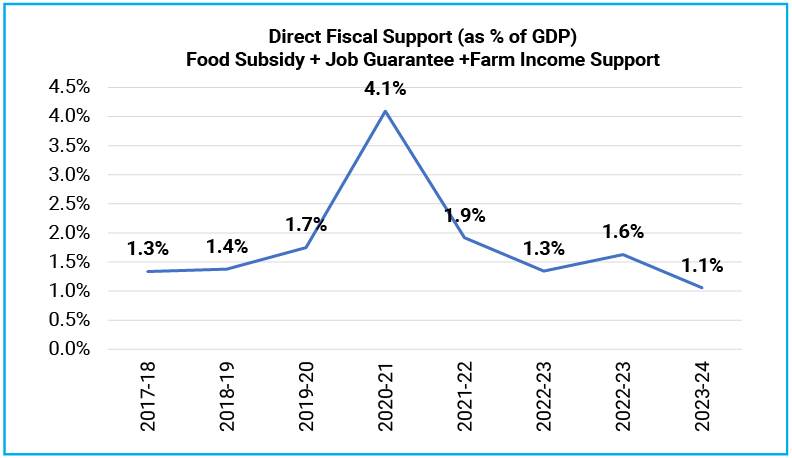
Direct fiscal support to the household has declined significantly over the last 3 years as both centre and state governments embarked on fiscal consolidation.
Chart - III: Declining Fiscal support makes the high fiscal deficit non-Inflationary
Source – India Budget Documents, Quantum Research
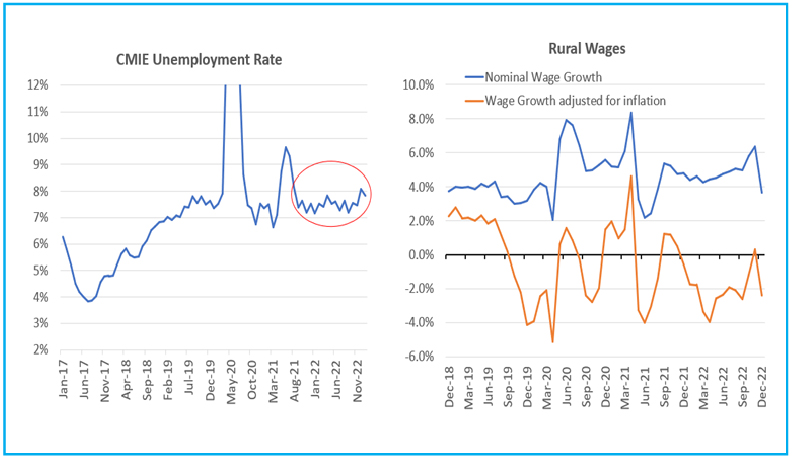
c. The employment situation remains weak with a high unemployment rate of around 8%. Formal sector job growth is also slowing down.
Rural wage growth improved marginally to around 6% in December. In real terms wage growth remains negative and is unlikely to have any material impact on inflation.
Chart – IV: Weak employment situation and muted salary growth restricting consumption demand
Source – CMIE, Quantum Research, Data Upto January 2023
d. Government’s price interventions (MSP increases) have been muted and are unlikely to have any material impact on the market price. However, global food and commodity prices remain a risk.[refer-Chart-II]
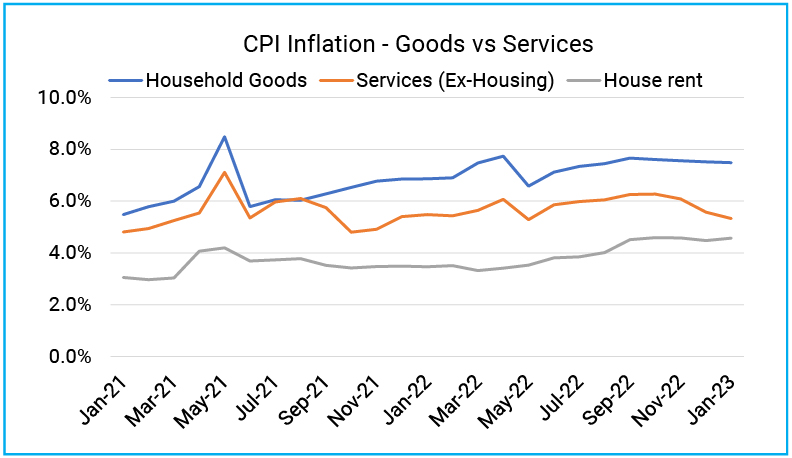
e. Household inflation expectation is very well anchored. It can also be seen in the services inflation which remains muted despite the high inflation of the last two years.
Chart - V: Services Inflation remains moderate due to tightly anchored household inflation expectation.
Source – MOSPI, Quantum Research, Data upto January 2023
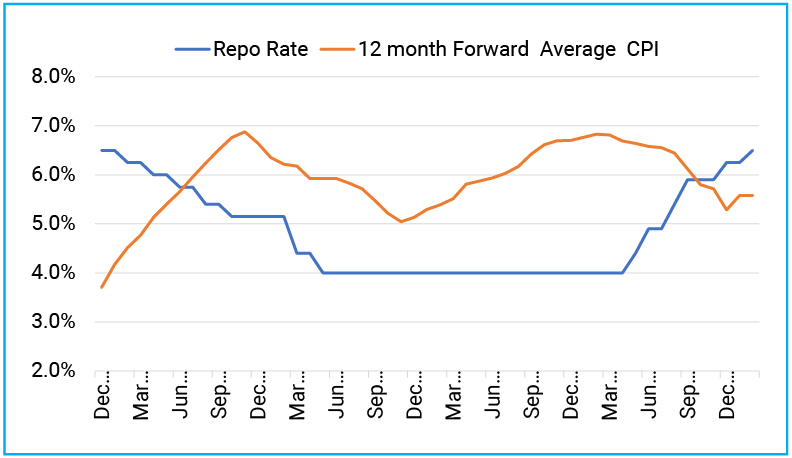
f. The monetary policy committee is laser-focused on inflation. It acted swiftly to tackle emerging inflation risk. Since May 2022, the RBI has raised the Repo rate by 250 basis points. The weighted average call rate in the money market has moved up more than 320 basis points during this period. The impact of past rate hikes is yet to be seen.
At the current level of 6.5%, the repo rate is now more than 100 basis points above the expected CPI inflation over the next 12 months.
Chart - VI: Frontloaded rate hikes pushed the repo rates significantly above the expected inflation rate
To summarise, the overall macro backdrop doesn’t support a persistent inflation condition. Much of the inflation was caused by temporary supply chain disruptions and one-off price shocks. The impact of these is now fading. Available evidence supports a decline in inflation to the 4%-5% band without needing any radical policy treatment.
What should Investors do?
The rate hiking cycle, if not over already, is nearing its end. Currently, government bonds across all maturities are trading above the expected CPI inflation for the next year. Even in nominal terms, most of the government bond yield curve is in the 7.30%-7.50% band.
Higher starting yields auger well for fixed-income returns as it increases the interest accrual on fixed-income instruments. Also, with monetary policy stabilising, there is room opening for capital appreciation over a medium-term horizon.
Chart – VII: The real rate is positive across the yield curve
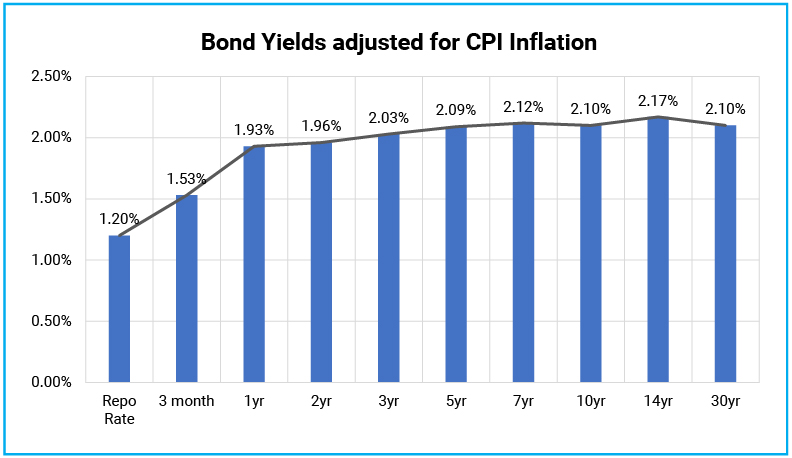
Source – Refinitiv, Quantum Research, Data as of February 22, 2022
Past Performance may or may not be sustained in future
All in all, the return potential of fixed-income funds has improved and the next three years are likely to be more rewarding for fixed-income investors than what we witnessed in the last three years.
We suggest investors with a 2-3 years holding period should consider adding their allocation to dynamic bond funds.
Dynamic bond funds have the flexibility to change the portfolio positioning as per the evolving market conditions. This makes dynamic bond funds better suited for long-term investors in this volatile macro environment than other long-term bond fund categories.
A Dynamic Bond Fund or any other debt fund which invests in long-term debt instruments are highly sensitive to interest rate movements. Thus, in a short period of time, returns could be highly volatile and can even be negative. However, over a longer time frame of over 2-3 years period, returns tend to normalize along with the interest rate cycles.
Investors with shorter investment horizons and low-risk appetite should stick with liquid funds. With the increase in short-term interest rates, we should expect further improvement in potential returns from investments in liquid funds going forward.
For any queries directly linked to the insights and data shared in the newsletter, please reach out to the author – Pankaj Pathak, Fund Manager – Fixed Income at [email protected].
For all other queries, please contact Neeraj Kotian – Area Manager, Quantum AMC at [email protected] / [email protected] or call him on Tel: 9833289034
Disclaimer, Statutory Details & Risk Factors:
The views expressed here in this article / video are for general information and reading purpose only and do not constitute any guidelines and recommendations on any course of action to be followed by the reader. Quantum AMC / Quantum Mutual Fund is not guaranteeing / offering / communicating any indicative yield on investments made in the scheme(s). The views are not meant to serve as a professional guide / investment advice / intended to be an offer or solicitation for the purchase or sale of any financial product or instrument or mutual fund units for the reader. The article has been prepared on the basis of publicly available information, internally developed data and other sources believed to be reliable. Whilst no action has been solicited based upon the information provided herein, due care has been taken to ensure that the facts are accurate and views given are fair and reasonable as on date. Readers of this article should rely on information/data arising out of their own investigations and advised to seek independent professional advice and arrive at an informed decision before making any investments.
Mutual fund investments are subject to market risks read all scheme related documents carefully.
Please visit – www.quantumamc.com/disclamer to read scheme specific risk factors. Investors in the Scheme(s) are not being offered a guaranteed or assured rate of return and there can be no assurance that the schemes objective will be achieved and the NAV of the scheme(s) may go up and down depending upon the factors and forces affecting securities market. Investment in mutual fund units involves investment risk such as trading volumes, settlement risk, liquidity risk, default risk including possible loss of capital. Past performance of the sponsor / AMC / Mutual Fund does not indicate the future performance of the Scheme(s). Statutory Details: Quantum Mutual Fund (the Fund) has been constituted as a Trust under the Indian Trusts Act, 1882. Sponsor: Quantum Advisors Private Limited. (liability of Sponsor limited to Rs. 1,00,000/-) Trustee: Quantum Trustee Company Private Limited. Investment Manager: Quantum Asset Management Company Private Limited. The Sponsor, Trustee and Investment Manager are incorporated under the Companies Act, 1956.
Related Posts
-

The Pivot
Posted On Friday, Apr 21, 2023
The fiscal year 2022-23 has come to an end. The defining feature
Read More -

Yield Curve Inversion Ahead
Posted On Thursday, Mar 23, 2023
Indian money markets have tightened meaningfully over the last one and a half month.
Read More -

Past, Present, and Future of Inflation
Posted On Friday, Feb 24, 2023
Inflation has been one of the biggest challenges in the post-pandemic world.
Read More


