
Investment
₹
Posted On Wednesday, Aug 11, 2021
Most investors look at returns as a yardstick to evaluate or compare one mutual fund from others. While this can be a starting point of assessing mutual funds, it may not give the complete picture. The performance alone, may not be sustained on a long-term basis due to the prevailing uncertainty in the markets. It is important to look at both qualitative and quantitative aspects when evaluating mutual funds.
A key source of this kind of information is your Monthly Factsheet.
Six key details you should not miss in your factsheet:
1. Investment Objective
This helps you understand the fund objective, the asset that it will invest in- equity, debt, or gold. It allows you to assess whether the scheme is sticking to its objective/ investment mandate.
Key Takeaway: Assess whether the fund objective aligns with your investment goal. For instance, equity mutual funds are for investors seeking to stay invested for three years & more. On the other hand, liquid funds are for short-term investors. |
2. Portfolio Allocation
A factsheet also provides the portfolio allocation to the underlying assets of equity, debt and the cash holdings available.
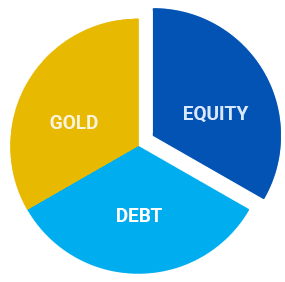
It also showcases the sectoral and company-wise allocation if any, in the fund. Factsheets helps you to assess whether the portfolio is diversified or biased towards any particular stock or asset.
When it comes to Debt Funds, it also indicates the underlying debt instruments – the proportion of Government securities, T-bills, commercial papers, etc. You can also understand the rating profile of the underlying assets. Credit rating agencies like CRISIL and ICRA assign a credit rating to fixed-income securities based on the financial strength of their issuer. An AAA rating depicts low credit risk and is considered the ‘highest’ rating, whereas a low credit rating like ‘C’; denotes securities in the other end of the spectrum and carry high default risk.
Key Takeaway: A cautious approach could be to invest in debt funds with underlying instruments of a high rating to avoid credit risk. Similarly, you would be better off in in a diversified equity fund rather than focusing on a particular sector or portfolio. |
3. Comparison to the Benchmark
You can evaluate the scheme’s historical returns over a 1 year, 3 years, 5 years, 7 years and from inception basis in comparison to its benchmark. While historical performance is not a guarantee of future returns, a long-term performance of greater than 3 years will give an idea of how often the scheme outperformed or underperformed the benchmark during different market cycles.
Key Takeaway: In the event, the fund is relatively new and has not completed the required tenure, evaluate how the fund has performed during a market cycle and capping a downside market. |
4. Risk Measures
Assess the different risk measures such as Alpha, standard deviation, Sharpe ratio and Beta to assess the underlying riskiness of the fund. Let’s explore the key questions answered by these risk measures about the mutual fund performance:
4.1. Alpha - How Effective is the Fund Manager in Outperforming the Benchmark Index
Alpha measures the relative returns generated in excess to the benchmark returns.
For instance, if you invested in a fund A that has the Sensex as the benchmark. And if the index has given 12% return and the mutual fund has generated 13.5% returns. This means an alpha of 1.5% as compared to the benchmark index. Correspondingly, if another fund B earns 10.5% returns, it would indicate an underperformance of 1.5%.
| Fund A | Fund B | Benchmark |
| 13.5% | 10.5% | 12% |
Key Takeaway: Evaluate the Alpha to assess the fund manager’s efficiency in consistently outperforming the index. |
4.2. Standard Deviation: How Much does the Fund Deviate from its Mean or Historical Average?
SD can be a key risk metric and an easy way to assess the stability anticipated in the mutual fund returns. SD measures how much a fund’s returns can fluctuate from its historical average.
For instance, if a fund has a 10% average return and SD of 4%, then its return can range between from 6-14%.
Key Takeaway: The greater the SD, the greater the chances of uncertainty in the fund. A conservative approach is to choose a fund with a lower SD. |
4.3. Sharpe Ratio: How Much Return Per Unit of Risk?
If you want to compare two funds offering the same level of returns, then the Sharpe Ratio can be one of the deciding factors. It helps you assess the risk per unit of return. It is an indicative measure reflecting the risk-adjusted returns.
Key Takeway: A higher Sharpe Ratio means the fund has the potential to protect you from market downsides. A conservative approach would be to look for a higher Sharpe Ratio. |
Let’s understand this by comparing two funds.
Fund A generates a return of 10%, while fund B delivers an 8% return.
If you look at the absolute values, fund manager A has performed better than fund manager B. But the Sharpe ratio of fund B is better, which means it can deliver a better risk-adjusted return.
| Fund A | Fund B | |
| Fund Returns | 10% | 8% |
| Risk-free return | 5% | 3% |
| Standard Deviation | 4% | 3% |
| Sharpe Ratio | = (10%-5%)/4% = 1.25% | = (8%-3%)/3% = 1.6% |
Fund A’s Sharpe Ratio comes to 1.25%, while Fund B’s Sharpe Ratio is 1.6%
This means that Fund B delivered a better risk-adjusted return than Fund A.
Key Takeaway: Look for a fund with a greater Sharpe Ratio to gain better risk-adjusted returns. |
4.4. Beta: How Sensitive is the Fund Performance Compared to its Benchmark Index
The benchmark has a default beta of 1. A beta of 1 means that the fund price will move with the market. Index Funds have a beta of 1 since the fund moves in line with the benchmark. A mutual fund with a Beta of less than 1 would mean that the fund is relatively less sensitive to market movements.
For instance, consider you have invested in a mutual fund X with a Beta value of 0.5. This means that for every rise or fall of 1 in the benchmark index, the value of mutual fund X will fall only half as much as the benchmark.
A high Beta of greater than 1 indicates the fund is subject to high volatility but has more return potential.
Key Takeaway: If you are looking for a portfolio that is less sensitive to market movements, you could look for a mutual fund with a lower beta value. |
5. Riskometer
As an investor in Mutual Funds, you will realize that a solution that works for another person may not work for you.
The suitability of a product, in other words, depends on the characteristics of the investor. The ‘Riskometer’ is a Securities and Exchange Board of India (SEBI) mandated meter that depicts the level of risk in any specific mutual fund scheme.

The Riskometer depicts six risk areas – Low, Moderately Low, Moderate, Moderately High, High and Very High Risk.
This Riskometer helps you understand the level of risk the scheme would be undertaking, is also provided.
Key Takeaway: Identify and invest in mutual fund schemes that correspond to your risk profile. |
6. Portfolio Turnover Ratio
A fund where the investors buy and hold for a long time has a relatively low portfolio turnover ratio. The portfolio turnover ratio (PTR) calculates the percentage of a fund’s holdings that have changed in a given year.
Key Takeaway: Look for a fund with a lower/moderate PTR that indicates low portfolio churn and thereby a well-researched investment portfolio. |
Take a look at the risk ratios of few of the Quantum Mutual Fund Schemes
| Fund | Standard deviation | Beta^^ | Sharpe^^ |
| Quantum Long Term Equity Value Fund | 21.82% | 0.95 | 0.45 |
| Quantum Tax Saving Scheme | 21.50% | 0.94 | 0.45 |
| Quantum Multi Asset Fund of Funds | 7.85% | 0.85 | 0.78 |
Data as of July, 2021
Past performance may or may not be sustained in future.
^^ Note: Risk Free Rate assumed to be 3.40% (FBIL Overnight MIBOR for July 31,2021) for calculating Sharpe Ratio. Standard Deviation, Sharpe Ratio & Beta are calculated on Annualized basis using 3 years history of monthly return.
All of these measures help you assess your mutual fund risk-reward tradeoff. A constant revaluation of your risk profile is needed to periodically rebalance your portfolio.
| Name of the Scheme | This product is suitable for investors who are seeking* | Riskometer |
| Quantum Long Term Equity Value Fund An Open Ended Equity Scheme following a Value Investment Strategy | • Long term capital appreciation • Invests primarily in equity and equity related securities of companies in S&P BSE 200 index. | 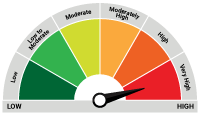 Investors understand that their principal will be at Very High Risk |
| Quantum Tax Saving Fund An Open Ended Equity Linked Saving Scheme with a Statutory Lock in of 3 years and Tax Benefit | • Long term capital appreciation • Invests primarily in equity and equity related securities of companies in S&P BSE 200 index and to save tax u/s 80 C of the Income Tax Act. Investments in this product are subject to lock in period of 3 years. | Investors understand that their principal will be at Very High Risk |
| Quantum Multi Asset Fund of Funds An Open Ended Fund of Funds Scheme Investing in schemes of Quantum Mutual Fund | • Long term capital appreciation and current income • Investments in portfolio of schemes of Quantum Mutual Fund whose underlying investments are in equity , debt / money market instruments and gold. | 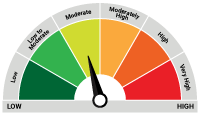 Investors understand that their principal will be at Moderate Risk |
The views expressed here in this article / video are for general information and reading purpose only and do not constitute any guidelines and recommendations on any course of action to be followed by the reader. Quantum AMC / Quantum Mutual Fund is not guaranteeing / offering / communicating any indicative yield on investments made in the scheme(s). The views are not meant to serve as a professional guide / investment advice / intended to be an offer or solicitation for the purchase or sale of any financial product or instrument or mutual fund units for the reader. The article has been prepared on the basis of publicly available information, internally developed data and other sources believed to be reliable. Whilst no action has been solicited based upon the information provided herein, due care has been taken to ensure that the facts are accurate and views given are fair and reasonable as on date. Readers of this article should rely on information/data arising out of their own investigations and advised to seek independent professional advice and arrive at an informed decision before making any investments.
Please visit – www.quantumamc.com/disclaimer to read scheme specific risk factors. Investors in the Scheme(s) are not being offered a guaranteed or assured rate of return and there can be no assurance that the schemes objective will be achieved and the NAV of the scheme(s) may go up and down depending upon the factors and forces affecting securities market. Investment in mutual fund units involves investment risk such as trading volumes, settlement risk, liquidity risk, default risk including possible loss of capital. Past performance of the sponsor / AMC / Mutual Fund does not indicate the future performance of the Scheme(s). Statutory Details: Quantum Mutual Fund (the Fund) has been constituted as a Trust under the Indian Trusts Act, 1882. Sponsor: Quantum Advisors Private Limited. (liability of Sponsor limited to Rs. 1,00,000/-) Trustee: Quantum Trustee Company Private Limited. Investment Manager: Quantum Asset Management Company Private Limited. The Sponsor, Trustee and Investment Manager are incorporated under the Companies Act, 1956.

Posted On Wednesday, May 07, 2025
April 2025 witnessed a reversal in FPI flows and an ease of global tariff related uncertainties, leading to a rise in broader indices.
Read More
Posted On Wednesday, Apr 16, 2025
Navigating the fast-paced investing world is like driving on a bustling highway—without risk mitigation strategies, you're as vulnerable as a driver speeding on a highway without a seat belt.
Read More
Posted On Tuesday, Apr 08, 2025
A new financial year is here—a clean slate, a fresh start, and a chance to get your investments in shape.
Read MoreGet In Touch
Take small steps in your financial planning to achieve big dreams! Start your investment journey today!
