Equity Monthly View for May 2025
Posted On Monday, Jun 09, 2025
May 2025 witnessed a broad-based recovery across indices with BSE Sensex gaining by 1.7%. The BSE mid and small cap indices rose sharply gaining 5.4% & 10.6% respectively in the month of May 2025. The equity markets for the month were driven by the US-China agreeing for tariff reductions and easing of geopolitical tension in India. The earning season continues to be muted with consensus earnings for FY26/27 further downgraded. The current estimate for Nifty 50 earnings in our view, now looks more reasonable at 10.6% and 10.9% for FY26/27.
The flows into equities remained resilient with strong DII (Domestic Institutional Investors) participation. Most of the emerging markets saw an uptick in FPI (Foreign Portfolio Investors) flows after a period of sharp outflows in the past few months and India also was no different garnering its fair share of flows during the month.
Table 1: Institutional Flows
| In USD Mn | CY2024 | CYTD 2025 | May-25 |
| FPI (Foreign Portfolio Investors) Flows | 124 | -11,376 | 2,344 |
| Mutual Fund Flows | 51,355 | 21,240 | 5,514 |
| Total DII (Domestic Institutional Investors) Flows | 62,346 | 31,932 | 6,618 |
Source: NSDL, SEBI, Data as of May 31, 2025
As shown in the table below (Refer Table 2), most of the sectors did well during the month, with sharp rebounds in capital goods, realty, and metals. Some of these sectors have seen a sharp decline in the past few months; however, with the government capex picking up, these sectors have performed well. Banks, FMCG and consumer durables were the laggards during the month.
Table 2: Performance of Major Indices during the Month

Source: Bloomberg, Data as of May 31, 2025
Past performance may or may not be sustained in the future.
Aggregate revenue growth continued to be soft for the March-2025 quarter. PAT (Profit After Tax) growth was driven by margin expansion due to softening input prices and price hikes. Some of the sectors such as telecom, utilities, OMC (oil marketing companies), pharma witnessed improvement in margins.
On a full year basis, the Revenue and PAT growth remain modest. Aggregate revenue and earnings growth for companies which have disclosed their Q4 FY25 and FY2025 results and are a part of the BSE 500 Index, are indicated in the below graph (Refer Graph 1 and 2).
Graph 1: Aggregate Revenue and Profit Growth in Q4 FY25 and FY2025 for BSE 500 companies

Source: Ace Equity; Data as of May 2025
Graph 2: Trend of Corporate Profitability for Listed Universe (% YOY)

Source: CMIE; Data as of May 2025; Net Sales and PBIDT (Profit Before Interest, Depreciation and Taxes) growth is considered.
While we remain focused on the long-term trends, it is important to note the current trends. Key sectoral highlights from the recent quarterly results are:
• Credit growth has moderated for majority of the banks driven by deposit mobilization challenges and regulatory headwinds. Asset quality barring few pockets continues to remain benign. Banks have cut down the deposit rates across tenures to defend margins in a declining interest rate environment. We expect credit growth to pick up as we progress through FY26.
• Consumer staples continue to report muted volumes amidst the ongoing urban slowdown. Margins were under pressure due to raw material headwinds. Valuation continues to remain expensive in these pockets.
• Auto names saw modest increase in volumes; sub-segments such as tractors and commercial vehicles witnessed better traction. Some of the holdings in our portfolio, especially of the two wheelers’ segment, saw margin improvement driven by better product mix and pricing actions.
• The demand environment has seen improvement for cement companies driven by government capex. With benign input cost and improvement in pricing environment, cement companies are witnessing an improvement in profitability.
• In the capital goods space the topline growth has clearly moderated. Order inflows across players remains flat. Barring few companies, margins are coming off for most capital good names. Over the long term, we expect competitive intensity to increase and margin to moderate from current levels.
• IT companies have guided for muted growth amid a deferment in discretionary spends arising from uncertainty around the U.S. government policies.
• Real Estate companies have reported moderate growth in pre-sales and collections on a high base. Overall inventory across the country remains at manageable levels.
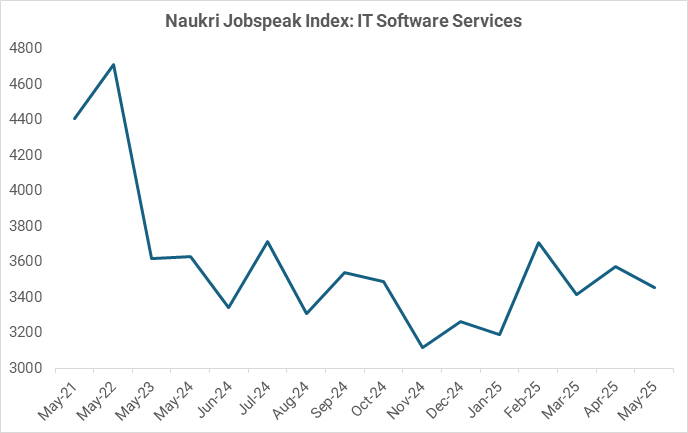
From a macro standpoint, CPI (Consumer Price Index) inflation has moderated further from 3.3% in March 2025 to 3.2% in April 2025, paving way for more rate cuts. Q4 FY25 Real GDP growth saw an acceleration at 7.4% and the GVA (Gross Value Added) growth stood at 6.8%. Government capex has picked up in the recent past while private consumption remains muted. The following tables (Tables 3 to 8) show the growth indicators of key frontline sectors. IT Services Annual Contract Value (ACV) remains flat, indicating a subdued hiring environment.
Table 3: Growth in Core Industries and GST Collection

Source: Office of Economic Advisor, Data as of May 2025
Table 4: Credit growth has moderated, and Fresh Term Deposit Rates are coming down

Source: Reserve Bank of India, Data as of April 2025
Table 5: New Investments Announcements have picked up, though private capex remains flat

Source: CMIE, Data as of March2025
Table 6: Residential Real Estate Sales are moderating on a high base; Home affordability remains attractive

Source: Knight Frank. Affordability Index indicates the proportion of income that a household requires, to fund the monthly instalment (EMI) of a housing. Data as of March 2025.
Housing Sales: Top 7 States. Source: Anarock. Data as of March 2025.
Table 7: Domestic Auto Sales (% YOY)

Source: Society of Indian Automobile Manufacturers, Tractor and Mechanization Association; Data as of April 2025
Table 8: Deal wins remain flat for IT Services

Source: ISG (Information Services Group). Data as of 1QCY25
Graph 3: Naukri Jobspeak Index highlights subdued hiring environment in IT Services

Source: Naukri Jobspeak Index, Data as of May 2025
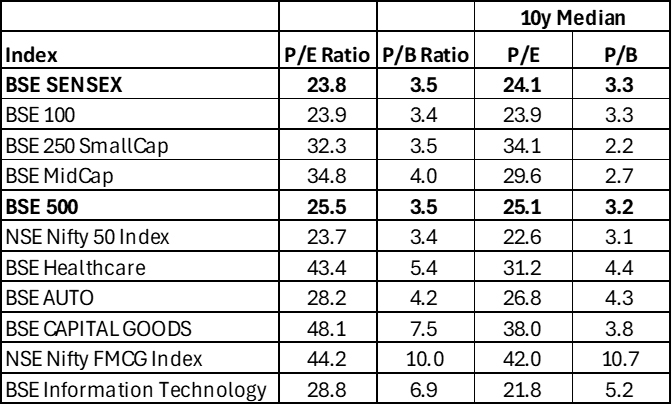
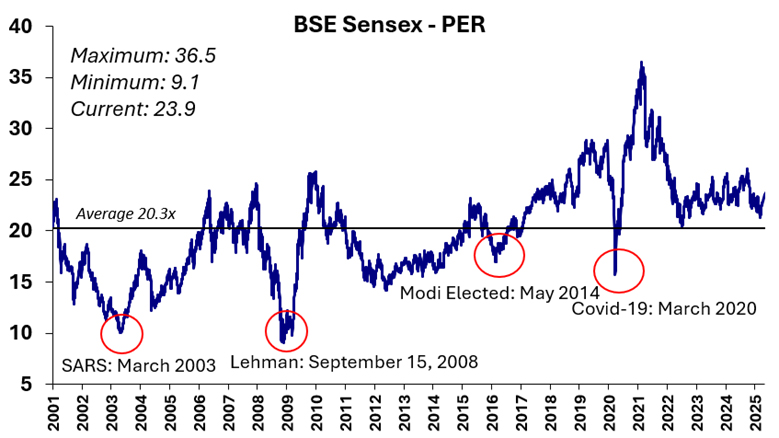
While the near-term economic trend is gradually recovering; valuations appear reasonable in pockets within the large cap space (Refer Table 9 and Graph 4). Benign inflation across food and fuel segments could keep inflation contained in the medium term. The ongoing interest rate cuts and potential consumption boost from recent income tax cuts augurs well for the economy over the medium term. While current valuation levels may not offer potential for super normal returns, risk reward appears reasonable in the large cap space. Investors may consider fortifying their large cap allocations to equity in a staggered manner.
Table 9: Current Valuation Vs Historic Median of major indices

Source: Bloomberg; P/E: Price to Earnings; P/B: Price to Book; Data as of May 31, 2025
Past performance may or may not be sustained in the future.
Graph 4: Long Term Valuation Chart of BSE Sensex Around Historic Average

Source: Bloomberg; Data as of May 31, 2025
Past performance may or may not be sustained in the future.
 |
Disclaimer, Statutory Details & Risk Factors:The views expressed here in this article / video are for general information and reading purpose only and do not constitute any guidelines and recommendations on any course of action to be followed by the reader. Quantum AMC / Quantum Mutual Fund is not guaranteeing / offering / communicating any indicative yield on investments made in the scheme(s). The views are not meant to serve as a professional guide / investment advice / intended to be an offer or solicitation for the purchase or sale of any financial product or instrument or mutual fund units for the reader. The article has been prepared on the basis of publicly available information, internally developed data and other sources believed to be reliable. Whilst no action has been solicited based upon the information provided herein, due care has been taken to ensure that the facts are accurate and views given are fair and reasonable as on date. Readers of this article should rely on information/data arising out of their own investigations and advised to seek independent professional advice and arrive at an informed decision before making any investments. Mutual Fund investments are subject to market risks, read all scheme related documents carefully. |
Related Posts
-

Equity Monthly View for May 2025
Posted On Monday, Jun 09, 2025
May 2025 witnessed a broad-based recovery across indices with BSE Sensex gaining by 1.7%.
Read More -

Equity Monthly View for April 2025
Posted On Wednesday, May 07, 2025
April 2025 witnessed a reversal in FPI flows and an ease of global tariff related uncertainties, leading to a rise in broader indices.
Read More -

Equity Monthly View for March 2025
Posted On Tuesday, Apr 08, 2025
After five months of decline, Sensex ended March 2025 with + 5.7% returns.
Read More


